Increase of renewable energy sources
e-RES % share of demand
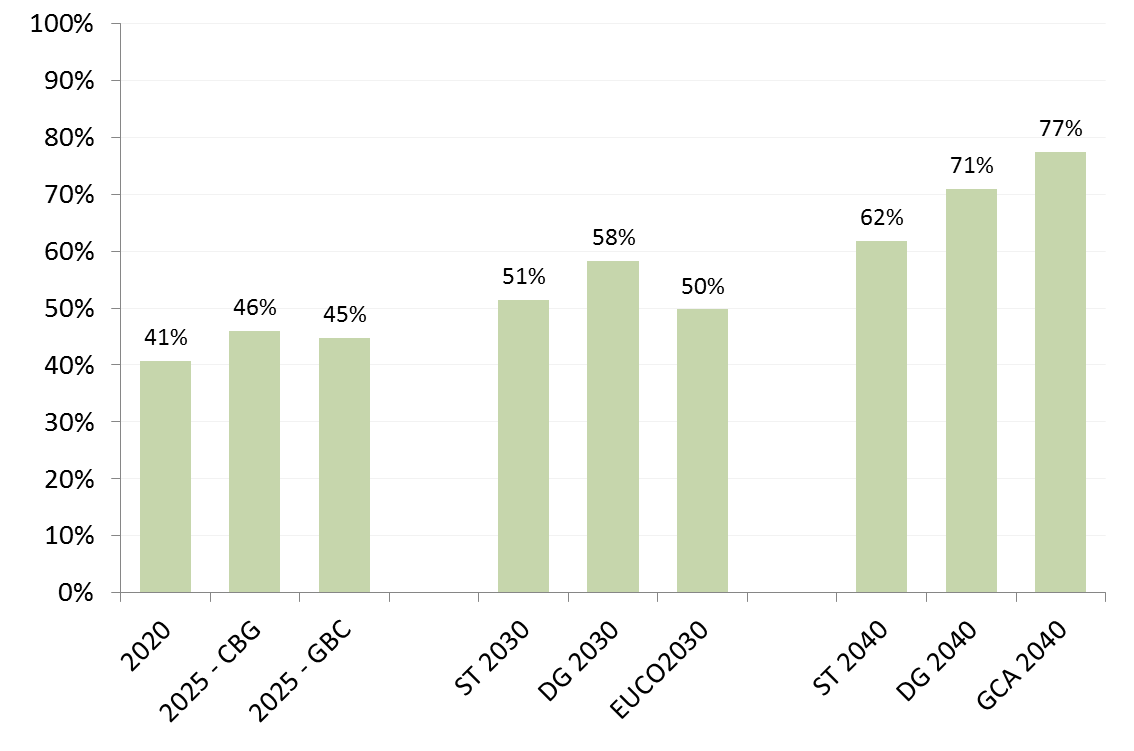
Figure 11: Percentage share of electricity demand covered by renewable generation by scenario
In the 2020 – 2025 scenario timeframe the amount of RES contributing to demand is 41% +/- 2%. In the 2030 scenarios this is 48% +/- 3%. This is to say there is not a large variance in the timeframes from 2020 – 2030. In the 2040 scenarios the variance between the scenarios can be seen at a much higher scale, this range is from 53% – 75% based on ENTSO-E market modelling.
When combined, there is moderate growth of wind and solar in the Sustainable Transition scenario which explains the conservative RES contribution. Global Climate Action has higher levels of wind generation than in Distributed Generation, producing 1510 TWh compared to 1170 TWh in 2040. On the other hand, Distributed Generation has a higher level of solar generation, producing 1090 TWh compared to 870 TWh. Whilst the 2 scenarios have a similar level of installed capacity in terms of wind and solar (51% GCA – 50% DG), the skew towards wind in the Global Climate Action scenario results in higher overall renewable generation.
g-RES % share of demand
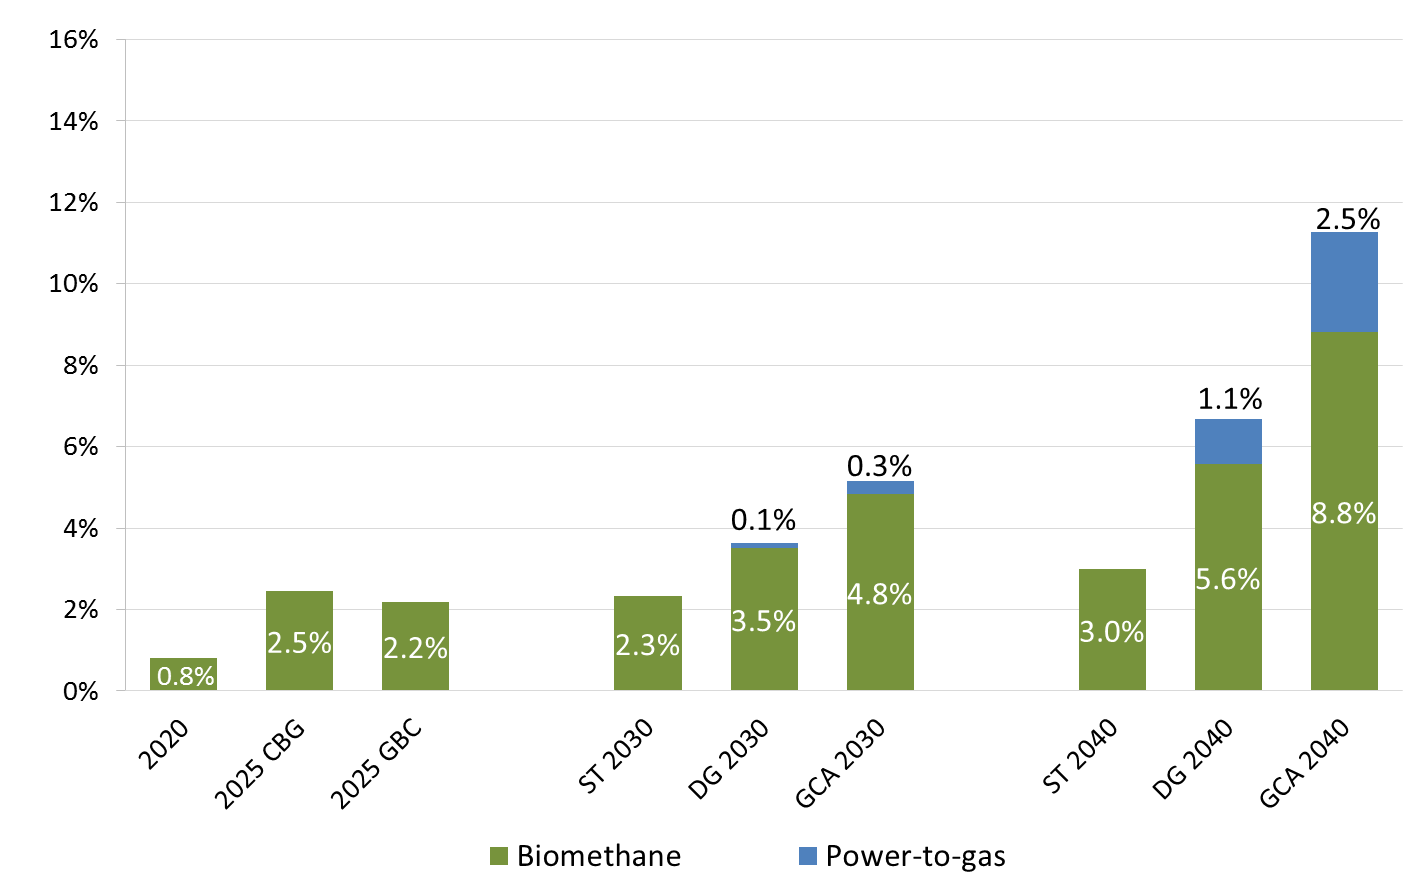
Figure 12: Percentage share of green gas supplying total gas demand by scenario
Bio-methane development is strong in all scenarios and forms the majority of the green gas supply. This only represents the bio-methane injected into the transmission network and the potential for the upgrading of biogas sources across the EU may offer further gains. P2G development starts from 2030 in Distributed Generation and Global Climate Action as variable RES increases.
This represents low volumes of synthetic natural gas entering the transmission network, but this is an emerging technology with potential that currently is being explored through a number of pilot projects and studies. It represents another interaction between the gas and electricity networks in the future.