ENTSO-E Processes
The following describes how the input data for TYNDP18 scenarios power market models are derived from the storylines. The storylines have previously been published following stakeholder engagement. The market models are used in the TYNDP to calculate optimal power plant dispatch. From this power market flows, electricity prices, emissions from electricity production and fuel usage from electricity production can be derived. The scenarios are not only used for TYNDP but also for the electricity Mid-term Adequacy Forecast (MAF). The MAF 2017 assesses electricity adequacy at Pan European level at the horizons 2020 and 2025.
Electricity scenarios for the TYNDP2018 consist of two kinds of scenarios: TOP DOWN scenarios and BOTTOM UP scenarios. BOTTOM UP scenarios are scenarios that are derived with numbers provided from each TSO. TOP DOWN scenarios are derived from the BOTTOM UP scenarios using a combination of rules and different kinds of optimisation. Rules define direct changes to the scenario. E.g.: % change in installed RES capacity, new fuel prices, demand, etc.
Reference grid
Each scenario is built using a reference grid adapted to its year (all scenarios within one year use the same grid). For the initial release of scenarios, ENTSO-E used the TYNDP 2016 reference grid, which is the most recent data available. This reference grid includes the current network plus all TYNDP 2016 projects which have a commissioning date earlier to the year considered, and which are included in National Development Plans.
ENTSO-E started in September 2017 a data collection for mature TYNDP 2018 interconnection projects to be included in the next reference grid. In its effort to constantly improve the TYNDP and scenarios methodologies, ENTSO-E has decided to modify the selection criteria by making them more restrictive. The next TYNDP reference grid will only include interconnection projects able to prove that they have already started the permitting phase, which indicates that significant investments have already succeeded in planning and designing the project.
Once this data is available, ENTSO-E will rerun the scenario models with the new, more restrictive reference grid, and include the results in the final release of the scenario report.
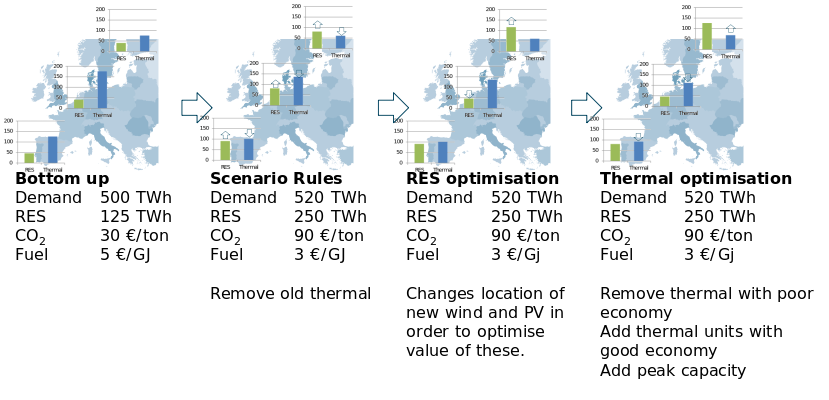
Figure 13 Illustration of scenario building steps from Bottom up to Top Down scenario.
| Year | Name | Type | Derived |
|---|---|---|---|
| 2020 | 2020 Best Estimate Scenario | Bottom up | Data collection among TSO’s |
| 2025 | 2025 Best Estimate Scenario Coal Before Gas | Bottom up | Data collection among TSO’s |
| 2025 | 2025 Best Estimate Scenario Gas Before Coal | Bottom up | Data collection among TSO’s |
| 2030 | 2030 Sustainable Transition | Bottom up | Data collection among TSO’s |
| 2030 | 2030 Distributed generation | Top Down | 2030 Sustainable Transition |
| 2030 | 2030 European Commission EUCO | Top Down | European Commission EUCO30 |
| 2040 | 2040 Sustainable Transition | Top Down | 2030 Sustainable Transition |
| 2040 | 2040 Distributed Generation | Top Down | 2030 Distributed Generation |
| 2040 | 2040 Global Climate Action | Top Down | 2030 Sustainable Transition |
Table 11: ENTSO-E scenario types