Reduction in CO2 emissions
CO2 emissions reductions for the power and gas sectors, compared to the 1990 level (EU28)
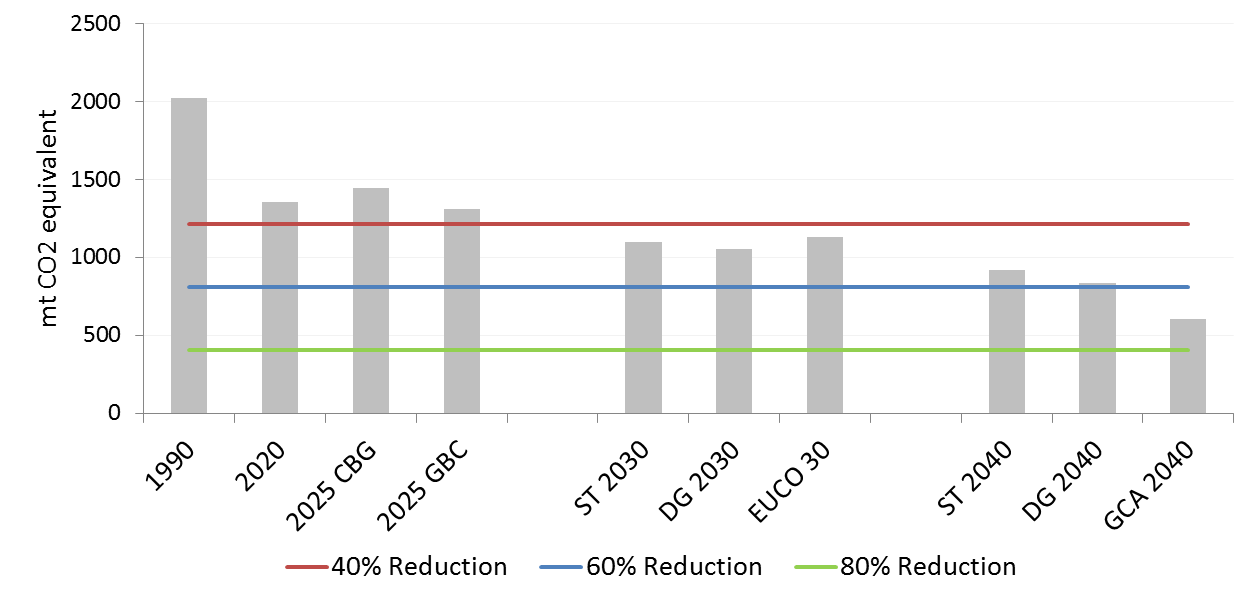
Figure 13: EU28 percentage reduction of CO2 emissions from power and gas sectors by scenario
In the short term, the impact of fuel prices has a visible effect in the 2025 merit order sensitivity analysis. The Gas Before Coal scenario shows a 35% reduction compared to 29% when coal is favoured.
The reduction in CO2 emissions goes beyond the 2030 target of 40% in all scenarios and shows varying degrees of progression towards the 2050 targets in the 2040 time horizon. It is important to note that this data represents all EU emissions from the two sectors and does not factor in reductions seen in other sectors due to fuel switches.
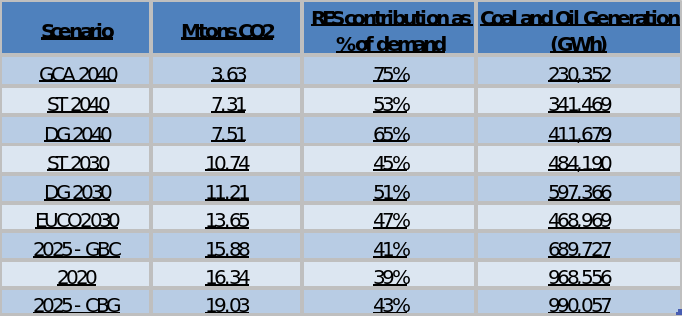
Table 1: CO2 production from power generation in ascending order, including EU28+ countries
The RES contributions are an important indicator for assessing CO2 emissions reduction. However, in the power sector the amount of CO2 also vastly depends on the rest of the energy mix. A higher level of coal generation in each scenario leads to higher CO2 emissions. Likewise, peaking units, which are used at very high demand times, are usually oil plants and emit CO2 levels between that of gas and coal.
CO2 emissions reductions for the power sector, compared to the 1990 level (EU28)
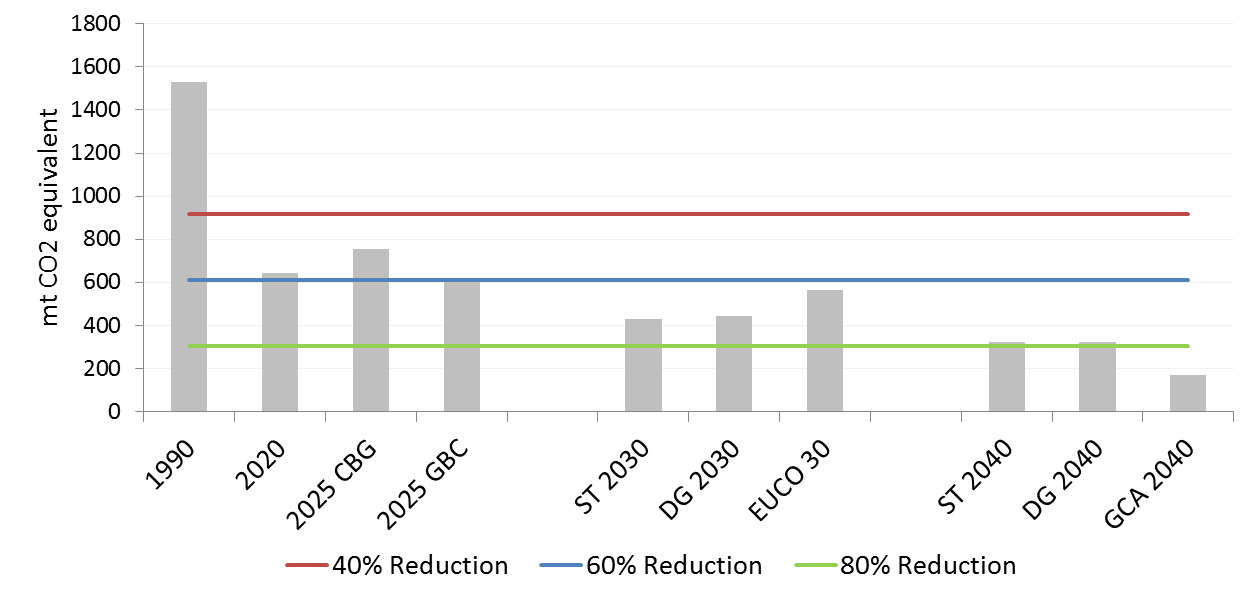
Figure 14: EU28 percentage reduction of CO2 emissions from the power sector by scenario
GCA is the scenario with the lowest amount of CO2 emissions. All of the 2030 and 2040 scenarios are on track with the decarbonisation targets for 2050.