Gas supply potentials
Indigenous production
Indigenous production covers supplies from inside EU coming from conventional national production and other non-fossil sources like biomethane and power-to-gas (P2G). Scenarios consider the role green gases will take in the European supply mix directly linked to the storylines.
The information on EU conventional production has been collected from TSOs and it is expected to decrease significantly over the next 20 years. ENTSOG has likewise used TSOs estimates on biomethane injection evolving differently for the three scenarios. Power-to-gas has been also considered in two out of three scenarios following the assumptions for P2G in Global Climate Action and Distributed Generation have been built out of a top-down methodology.
Taking into account the scenarios chosen based on stakeholder feedback and that no inputs were shown by gas TSOs during the data collection process, no shale gas from inside EU has been taking into account at all during the whole time horizon of this report.
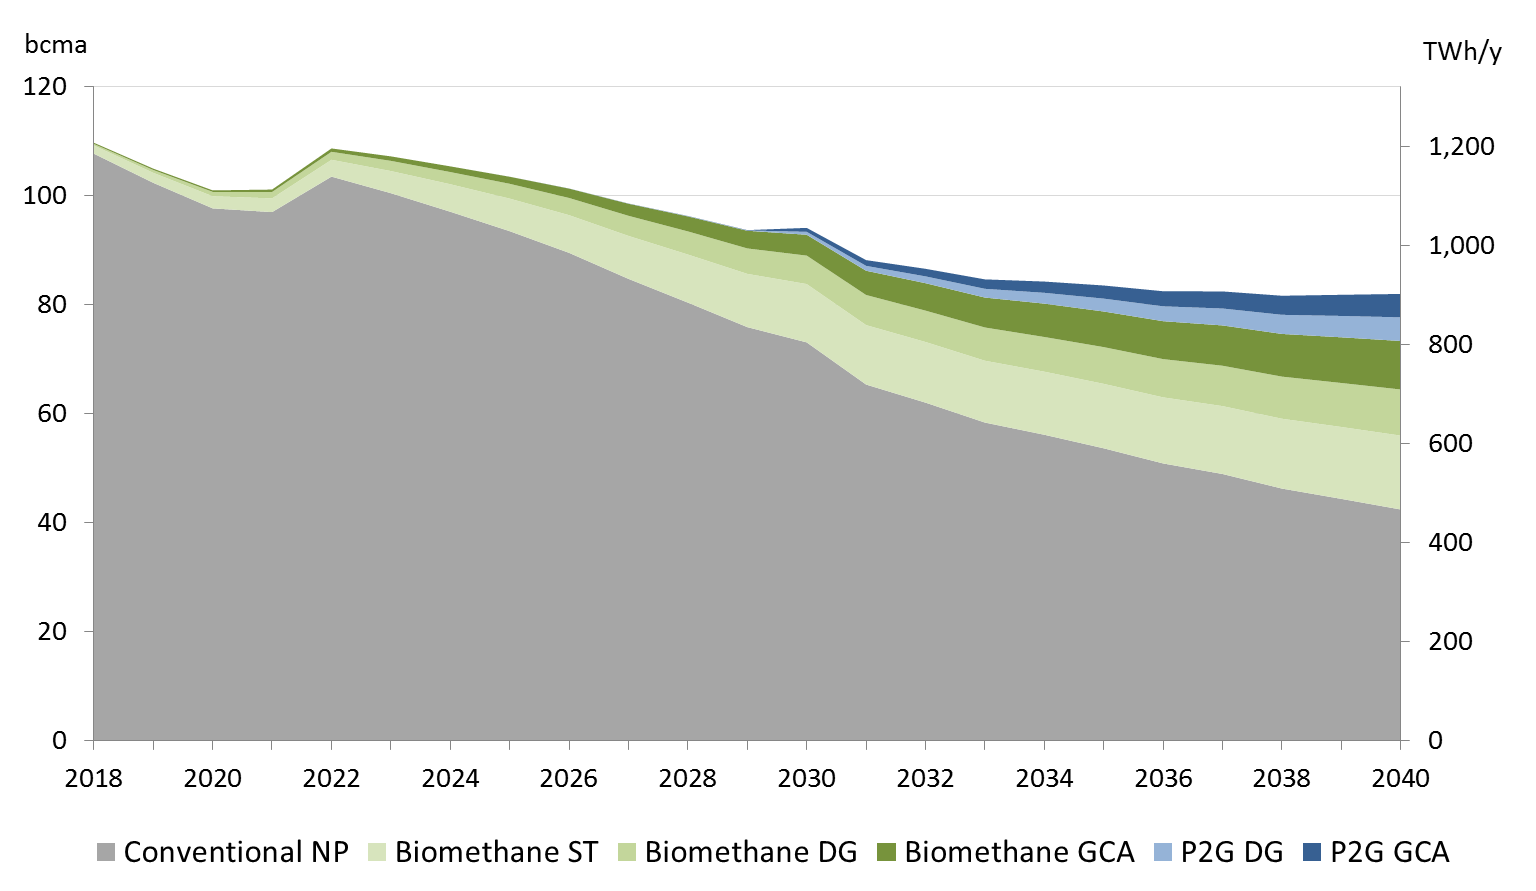
Figure 40: Potential EU indigenous and green gases production 2018-2040
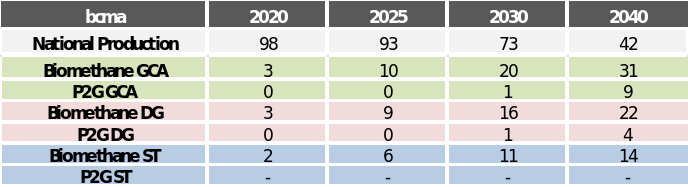
Table 1: Potential EU indigenous and green gases production 2018-2040
- Extra-EU Supply Potentials
Supply potentials have been developed for the purpose of this Scenario Building Report as the reasonable prospective supplies coming from current and realistic new sources known until today. The word “potential” means that these gas supplies cannot be considered as forecasts of future flows. In order to capture the uncertainty in the development of supplies, ranges have been defined for each source to assume their minimum and maximum as the lower and upper limits for the imports.
The development of the supply potentials is based on publicly available information, reports and recent news. These potentials cover supplies from outside EU coming from Russia, Norway, Algeria, Libya, Azerbaijan, LNG and other new potential sources. For those sources exporting gas, both as pipeline-bounded gas and LNG, the potential supplies have been treated separately in order to avoid double counting. Each supply potential is developed independently and no specific likelihood is defined.
It is important to highlight that all potential gas supplies from outside EU are independent to the main scenarios. Supply potentials provide ranges to the assessment model where the supply mixes are assessed during the TYNDP simulations stage to then obtain the final supply mixes results.
Where historical ranges are shown, this is based on data available from 2009 to 2016, unless otherwise stated.
Russian pipeline supply potentials
These supply potentials define a possible range of Russian gas exports to Europe via pipeline. Although some sources report that Russia has the potential to increase both production and gas exports to Europe by around 100 bcm, this potential would lead to figures exceeding 250 bcm meaning to the overall EU demand a share of Russian gas in the European supply of over 50% which is currently not seen as realistic. The potential range of Russian pipeline supply has been estimated as follows:
- Maximum Russian pipeline gas potential:
Own methodology based on Russian Production IEA World Energy Outlook 2016 - New Policies Scenarios - multiplied by the historical maximum share (29%) exported to EU (source BP Statistical).
- Minimum Russian pipeline gas potential:
This potential has been determined based on the publication "The Political and Commercial Dynamics of Russia’s Gas Export Strategy" (Oxford Institute for Energy Studies, James Henderson & Tatiana Mitrova, September 2015), “Europe 70% ToP” evolution shown in Figure 12: Potential impact of new Asian contracts on Russian gas exports in a worst case scenario in Europe.
Russian also exports in the form of LNG but these volumes are part of the LNG analysis.
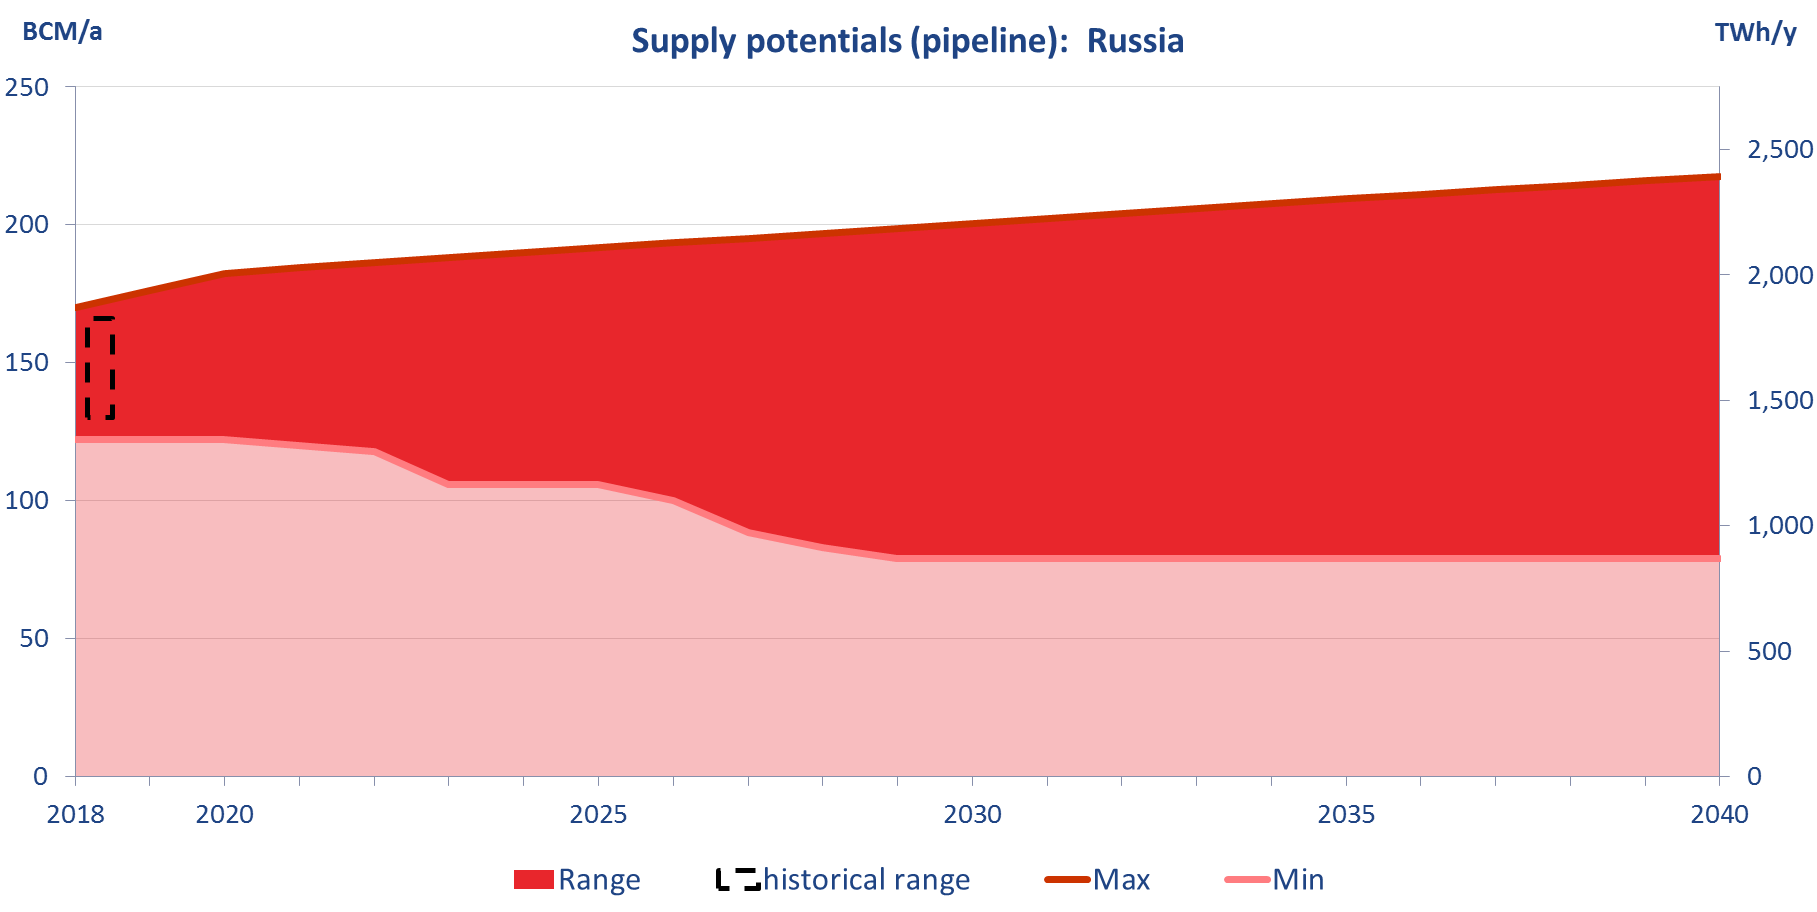
Figure 41: Potential pipeline gas potentials from Russia
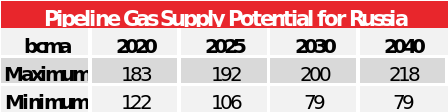
Table 2: Potential pipeline gas potentials from Russia (bcma)
Norwegian pipeline supply potentials
These supply potentials define a possible range of Norwegian gas exports to Europe via pipeline. The Norwegian supply potentials are based on data coming from the Norwegian Petroleum Directorate (NPD) / Ministry of Petroleum and Energy (MPE) as provided by GASSCO. The potential range of Norwegian supply has been estimated as follows:
- Maximum Norwegian pipeline gas potential:
This potential represents the exports from Norway where the maximum level is the development of annual exports as estimated on the maximum scenario (from the Norwegian Petroleum Directorate) including existing fields, discoveries and yet to find fields, extrapolated from 2035 to 2040.
- Minimum Norwegian pipeline gas potentials:
This potential takes the lowest of the minimum imports of 2009-2016 (93 bcma) interpolated to the production sales forecast in 2015 of resources in existing fields (Norwegian Petroleum Directorate), extrapolated between 2035 and 2040.
Norwegian LNG exports are part of the LNG potentials featured later in this report.
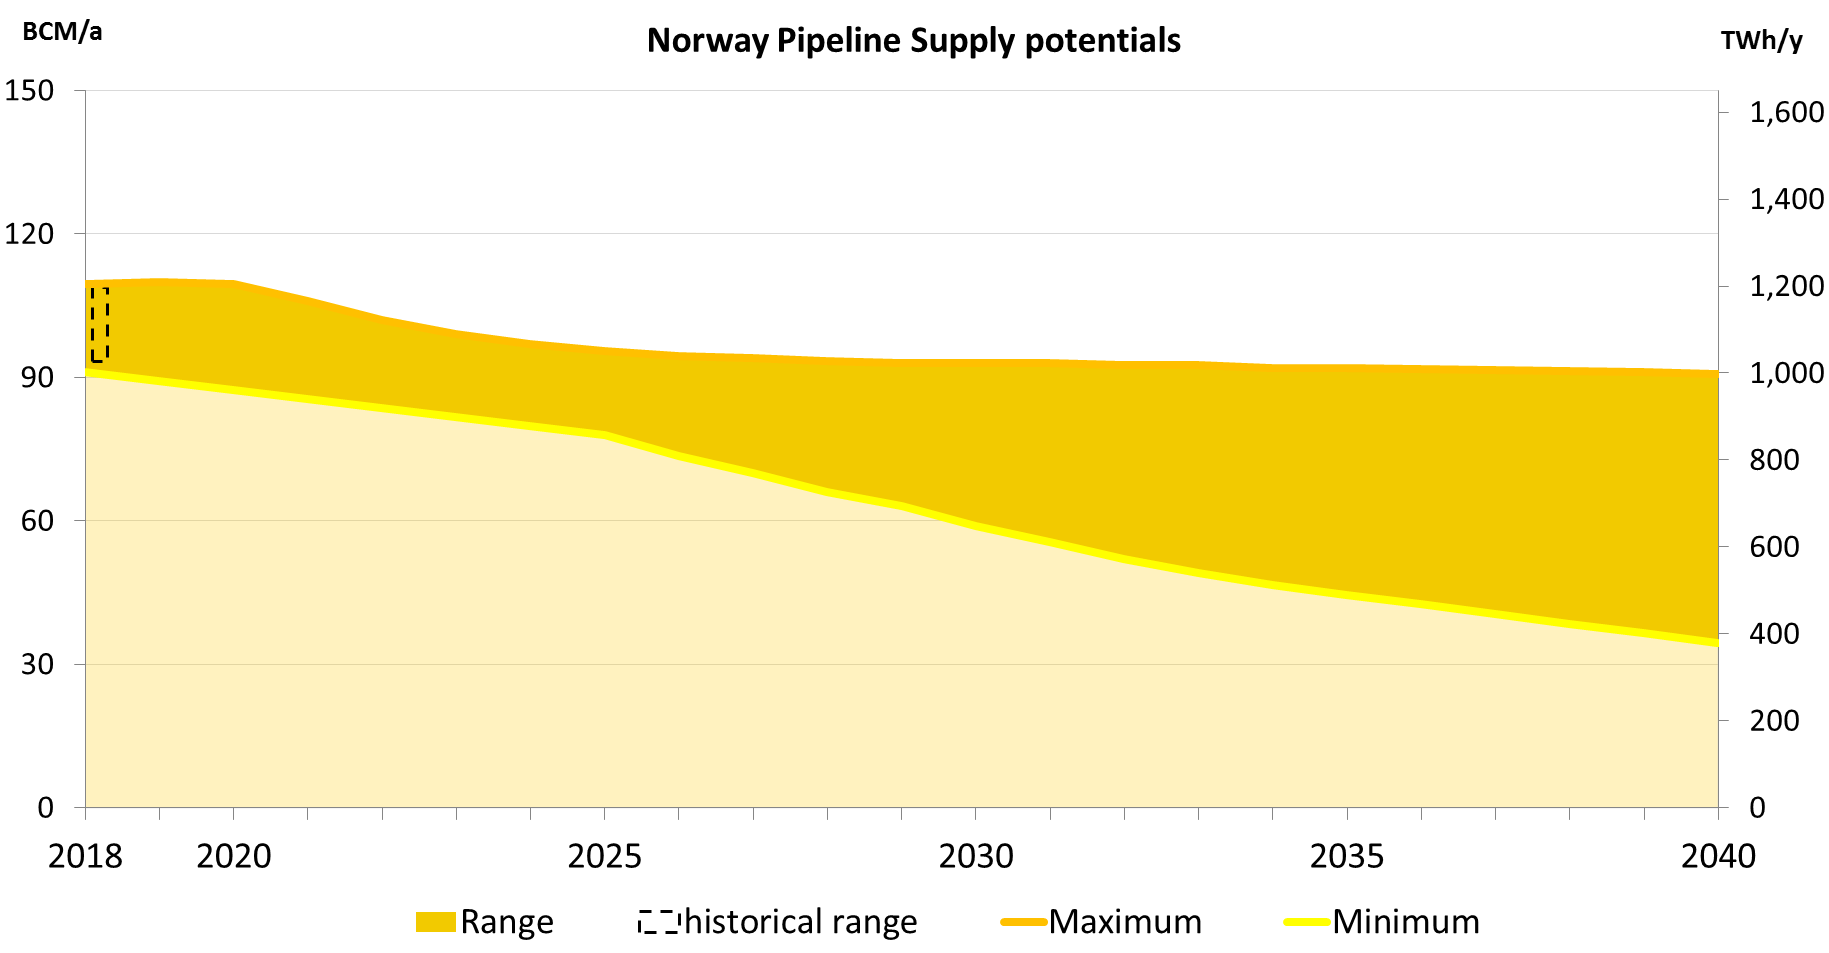
Figure 42: Potential pipeline gas potentials from Norway
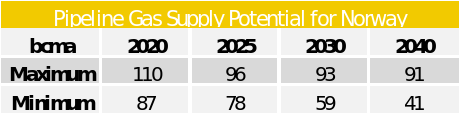
Table 3: Potential pipeline gas potentials from Norway (bcma)
Algerian pipeline supply potentials
Algeria ranks in the top ten of countries with the largest gas reserves in the world, being the second largest reserves in Africa. Its export potential will highly depend on the amount of new investments in the upstream sector. In order to define its maximum and minimum supply potentials ENTSOG has considered different sources:
- Maximum Algerian pipeline gas potential
Own methodology based on Algerian Production IEA World Energy Outlook 2016 - New Policies Scenarios - multiplied by the historical maximum share (43%) exported to EU (source BP Statistical).
- Minimum Algerian pipeline gas potential
Based on Oxford report May 2016 “Algerian Gas: Troubling Trends, Troubled Policies” starting on recently observed historical minimum (from BP Statistical) interpolated to 2025.
Algeria also exports LNG which is included as part of the LNG analysis.
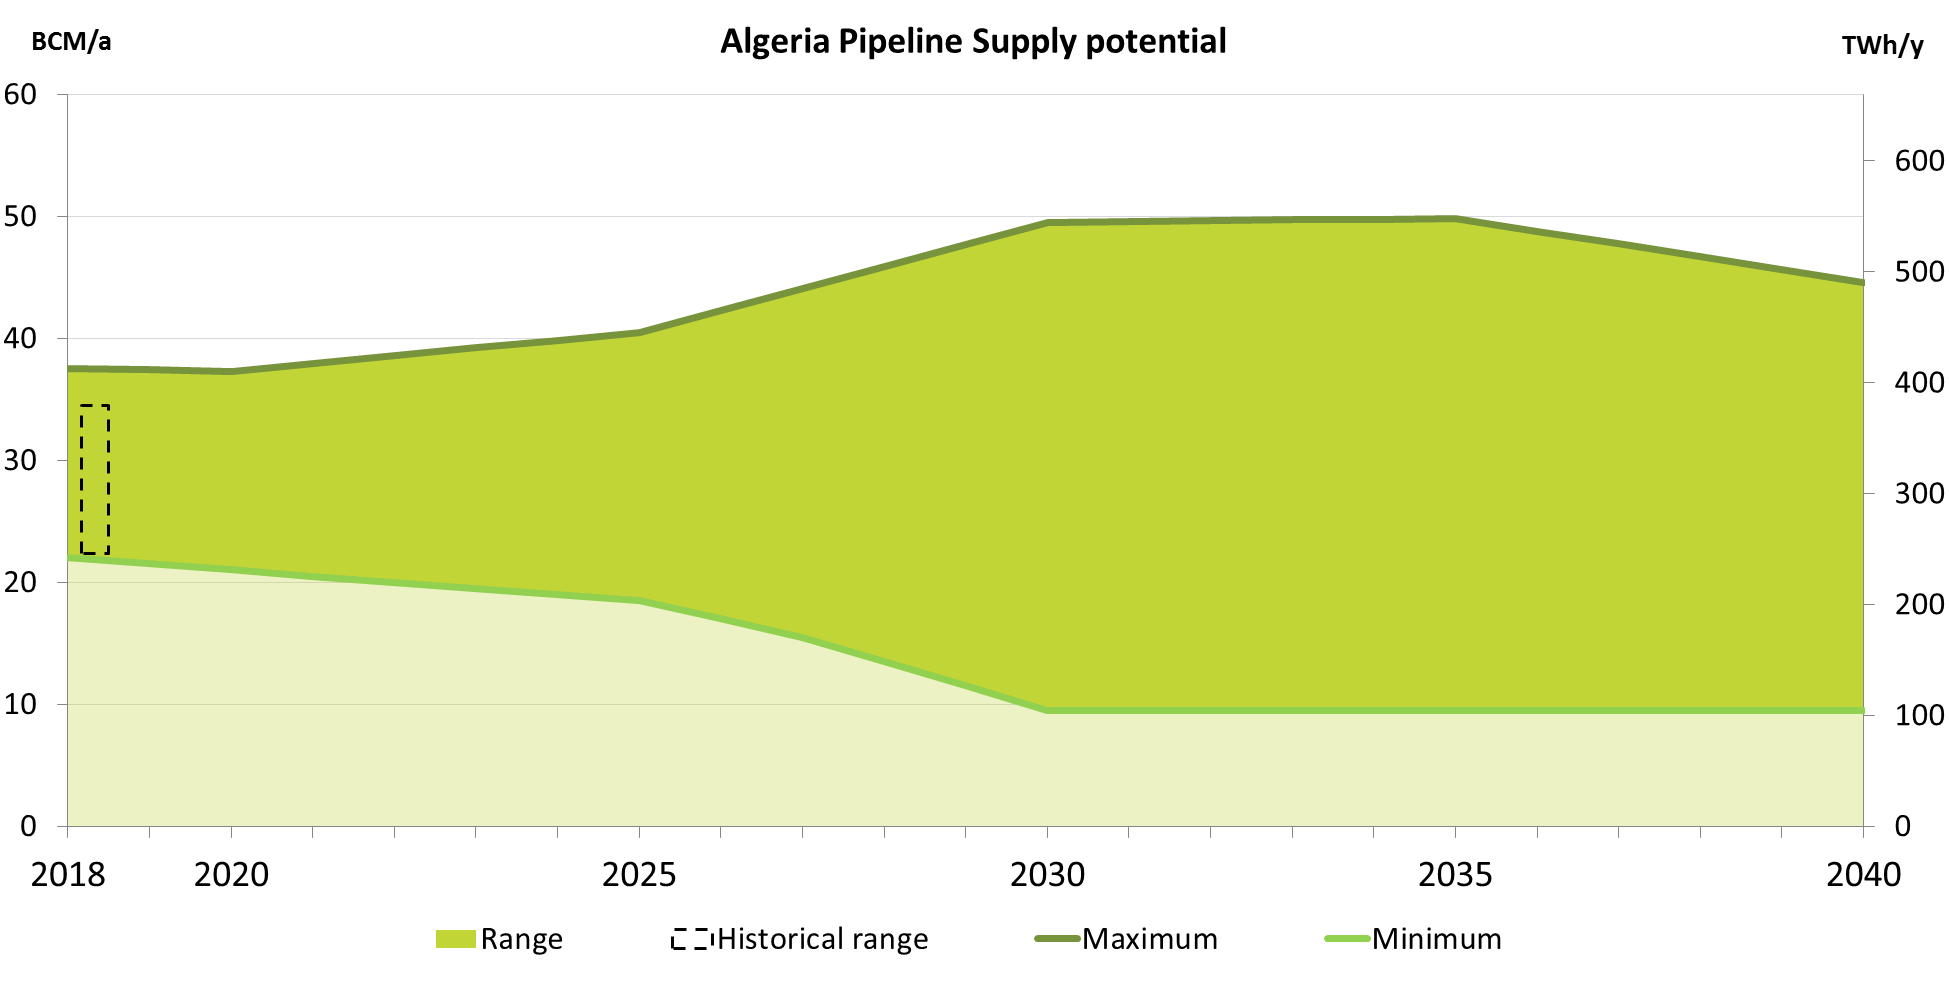
Figure 43: Potential pipeline gas potentials from Algeria
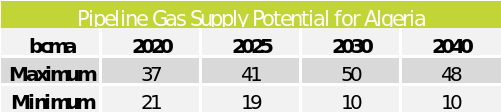
Table 4: Potential pipeline gas potentials from Algeria (bcma)
Libyan pipeline supply potentials
Libya is currently the smallest gas supplier of the EU via Green Stream pipeline which connects Libya to Italy with a total capacity of around 12 bcma. In 2011 Libyan exports to Italy were completely interrupted due to the civil turmoil and Masra El-Brega LNG plant was damaged and since then Libya has not exported LNG again. ENTSOG has considered a maximum and a minimum potential for Libyan pipe exports based on different assumptions:
- Maximum Libyan pipeline gas potential
Based on the technical export capacity of Greenstream pipeline (354 GWh/d), the maximum potential assumes a 90% load factor of the pipeline (319 GWh/d)
- Minimum Libyan pipeline gas potential
The minimum potential is based on the average of the two lowest exporting years 2.5 bcm in 2011 and 4.4 bcm in 2016.
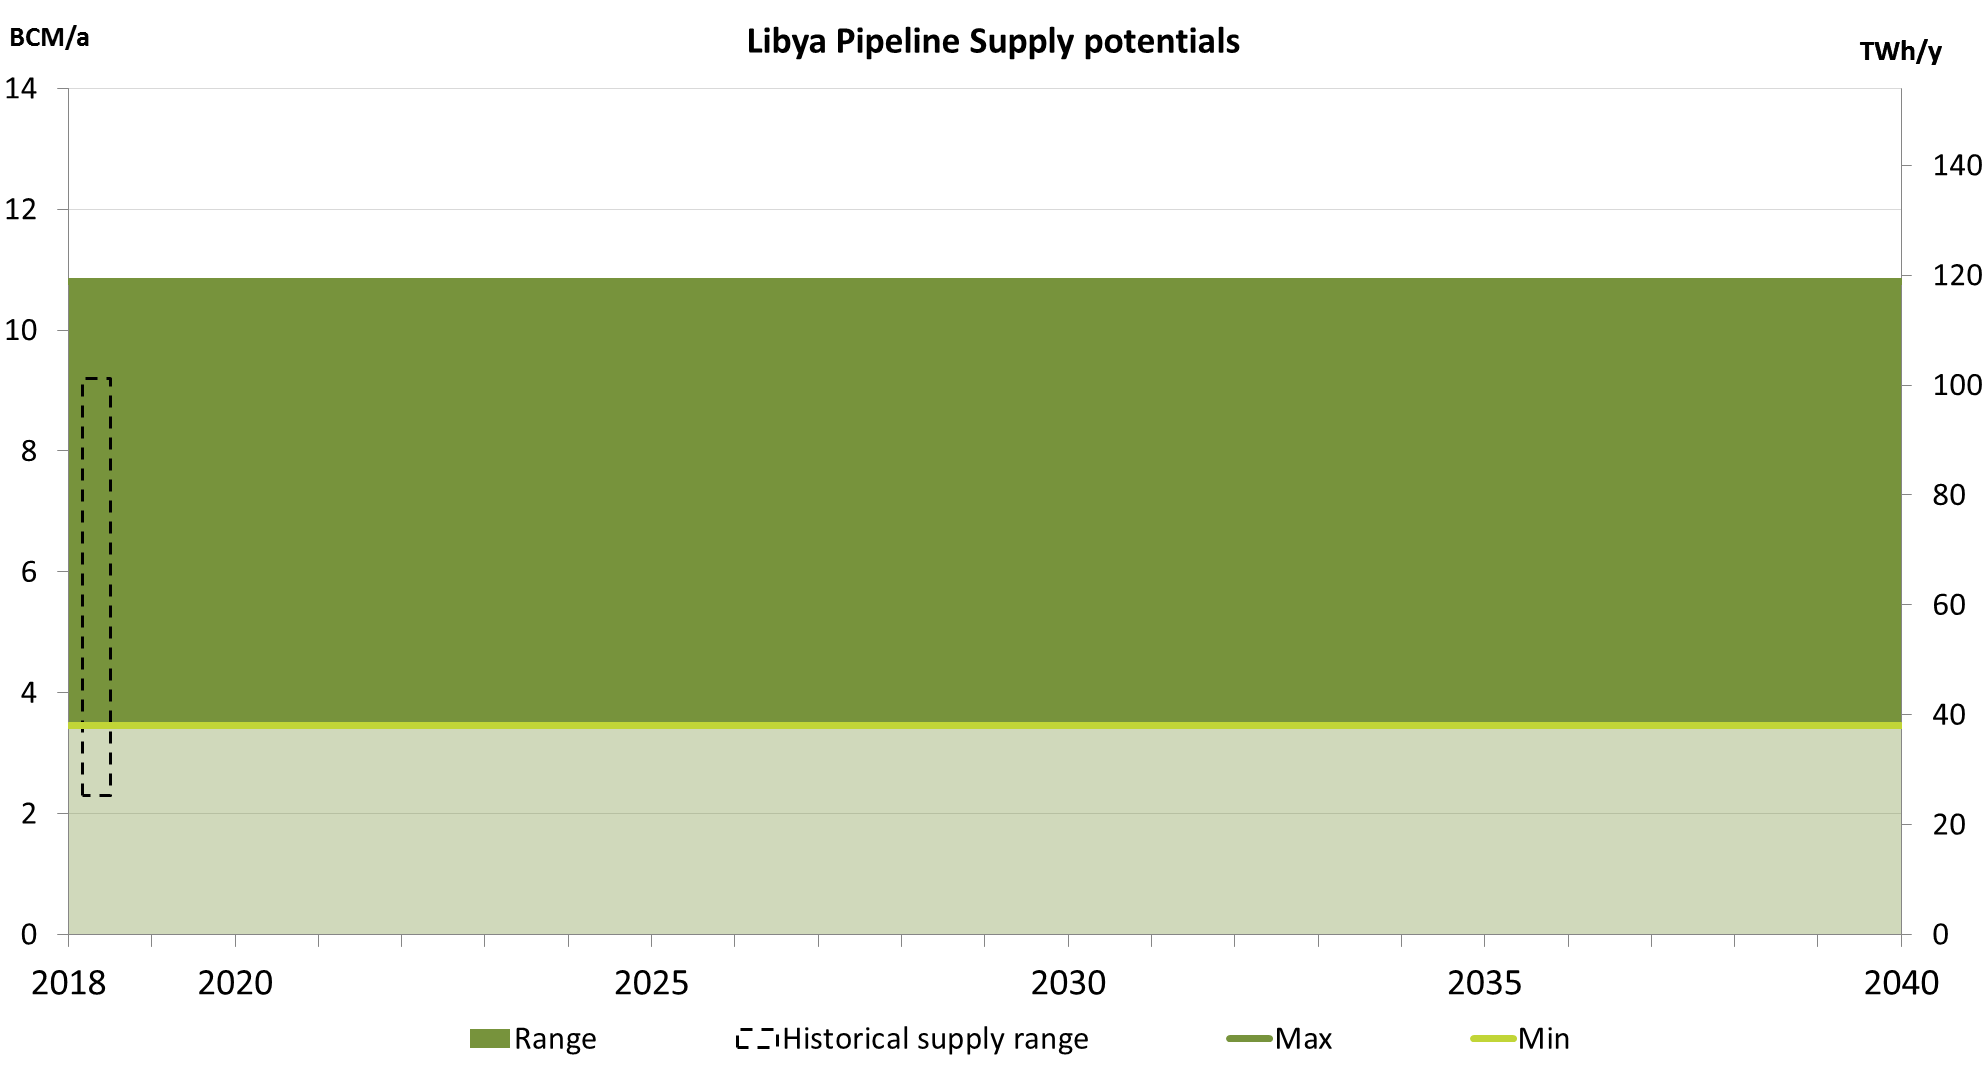
Figure 44: Potential pipeline gas potentials from Libya
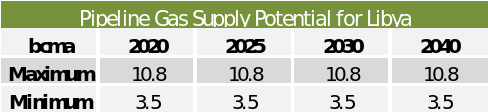
Table 5: Libya pipeline gas potential potentials (bcma)
Azeri pipeline supply potentials
Shah Deniz phase 1 production has already started and will remain stable and limited to regional markets. ENTSOG considers as potential Azeri supply for EU gas coming from phase 2 starting as of 2019.
- Maximum Azeri pipeline gas potential
This potential considers the 10 bcma (110 TWh/y) for the EU market as it was done in TYNDP 2017. The ramp-up phase gradually increases the gas imports from 2019 to 2022.
- Minimum Azeri pipeline gas potentials
With the final decision of the aforementioned transit route, the likelihood of receiving some gas can now be considered sure. Hence, this minimum potential has been set at 80 % of the maximum one.
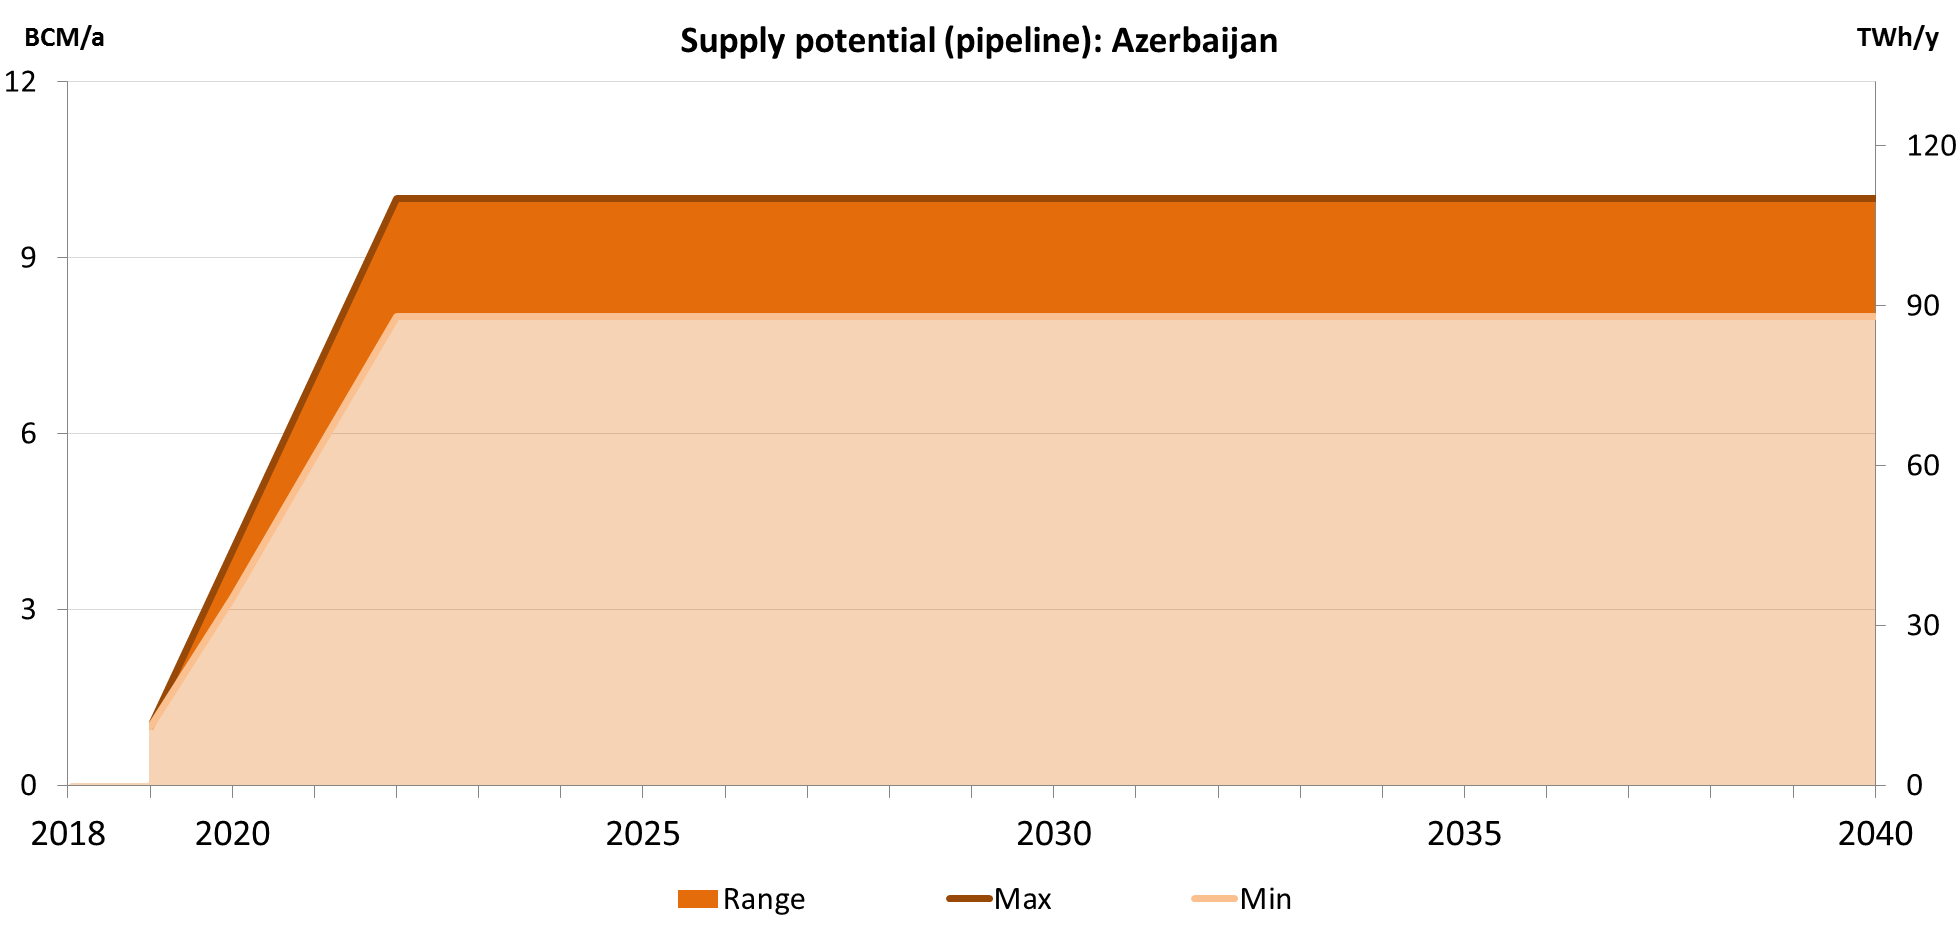
Figure 45: Pipeline gas potentials from Azerbaijan
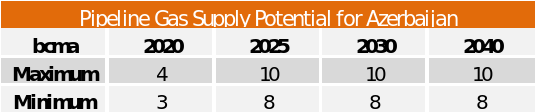
Table 6: Pipeline gas potentials from Azerbaijan (bcma)
LNG supply potentials
LNG is traded in a global market which has been constantly growing during the last decades. By giving access to a large variety of sources and routes, LNG makes gas reserves around the world accessible to the EU market. The ranges defined for the LNG import potentials reflect the particularly high uncertainty in the level of LNG supplies to Europe.
- Maximum LNG potential
New LNG export capacity based on WEO 2016 New Policies scenario trading mix from Middle East, Australia, North America, Sub Saharan Africa and Latin America. Starting point of 83 bcm as the historical year peak imports (2011, BP Statistical 2012) plus additional surplus from the net exporting regions projected in the WEO 2016 (NPS) for 2025 and 2040.
Highest historical maximum share is applied to the LNG exporting regions ME, North Africa, Sub Saharan Africa. For N. America, S. America and Australia the share is estimated based on WEO trading flows. Other LNG exports are considered as from Russia (WEO) and Norway (considering their 90% capacity). Some values have been rounded for maximization on a statistical 95% sensitivity.
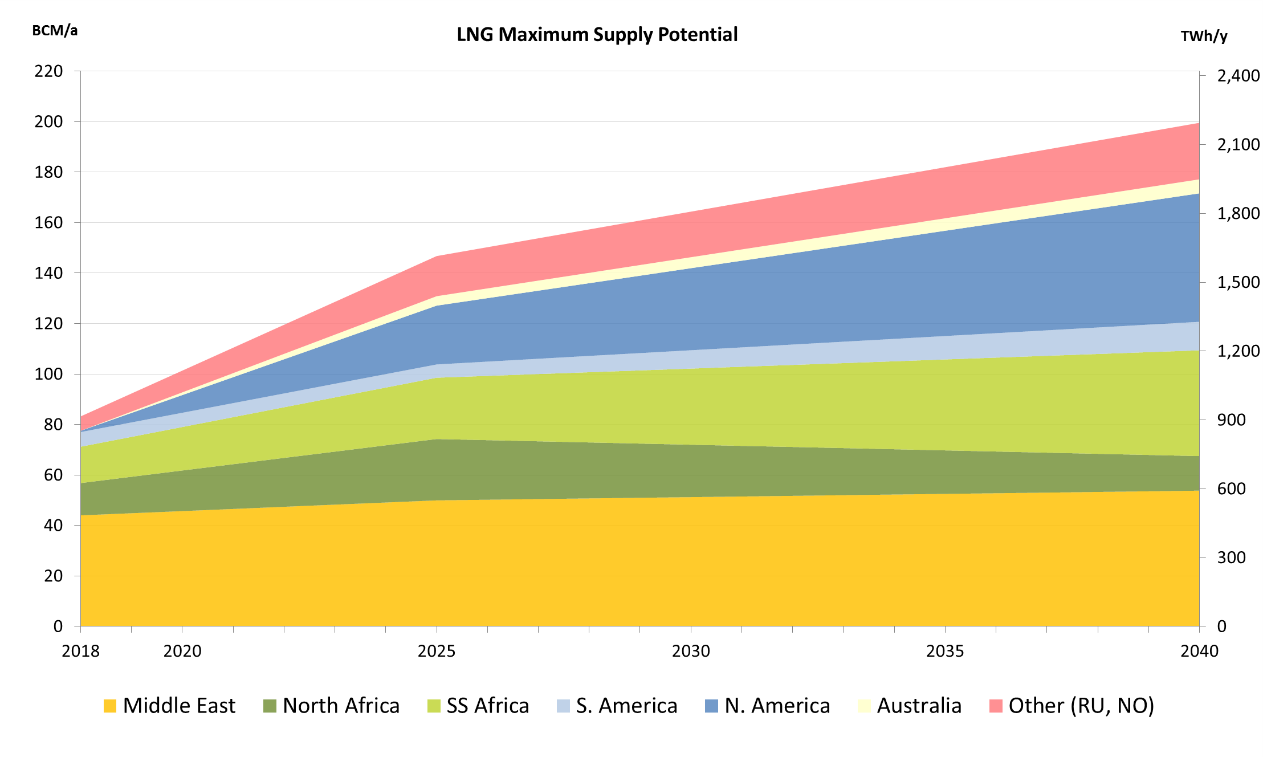
Figure 46: Maximum LNG potential
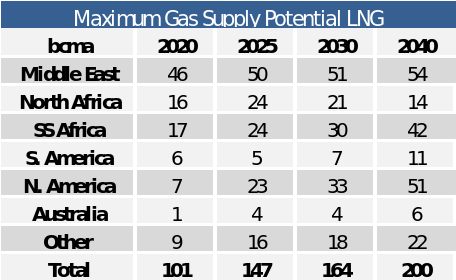
Table 7: LNG maximum potentials (bcma)
- Minimum LNG potential
The minimum supply potential has been defined on the assumption of a decrease of the imports to a 70 % of the minimum EU imports between 2009 and 2016 and applying the exporting share to all regions excluding Australia which minimum has been kept as zero.
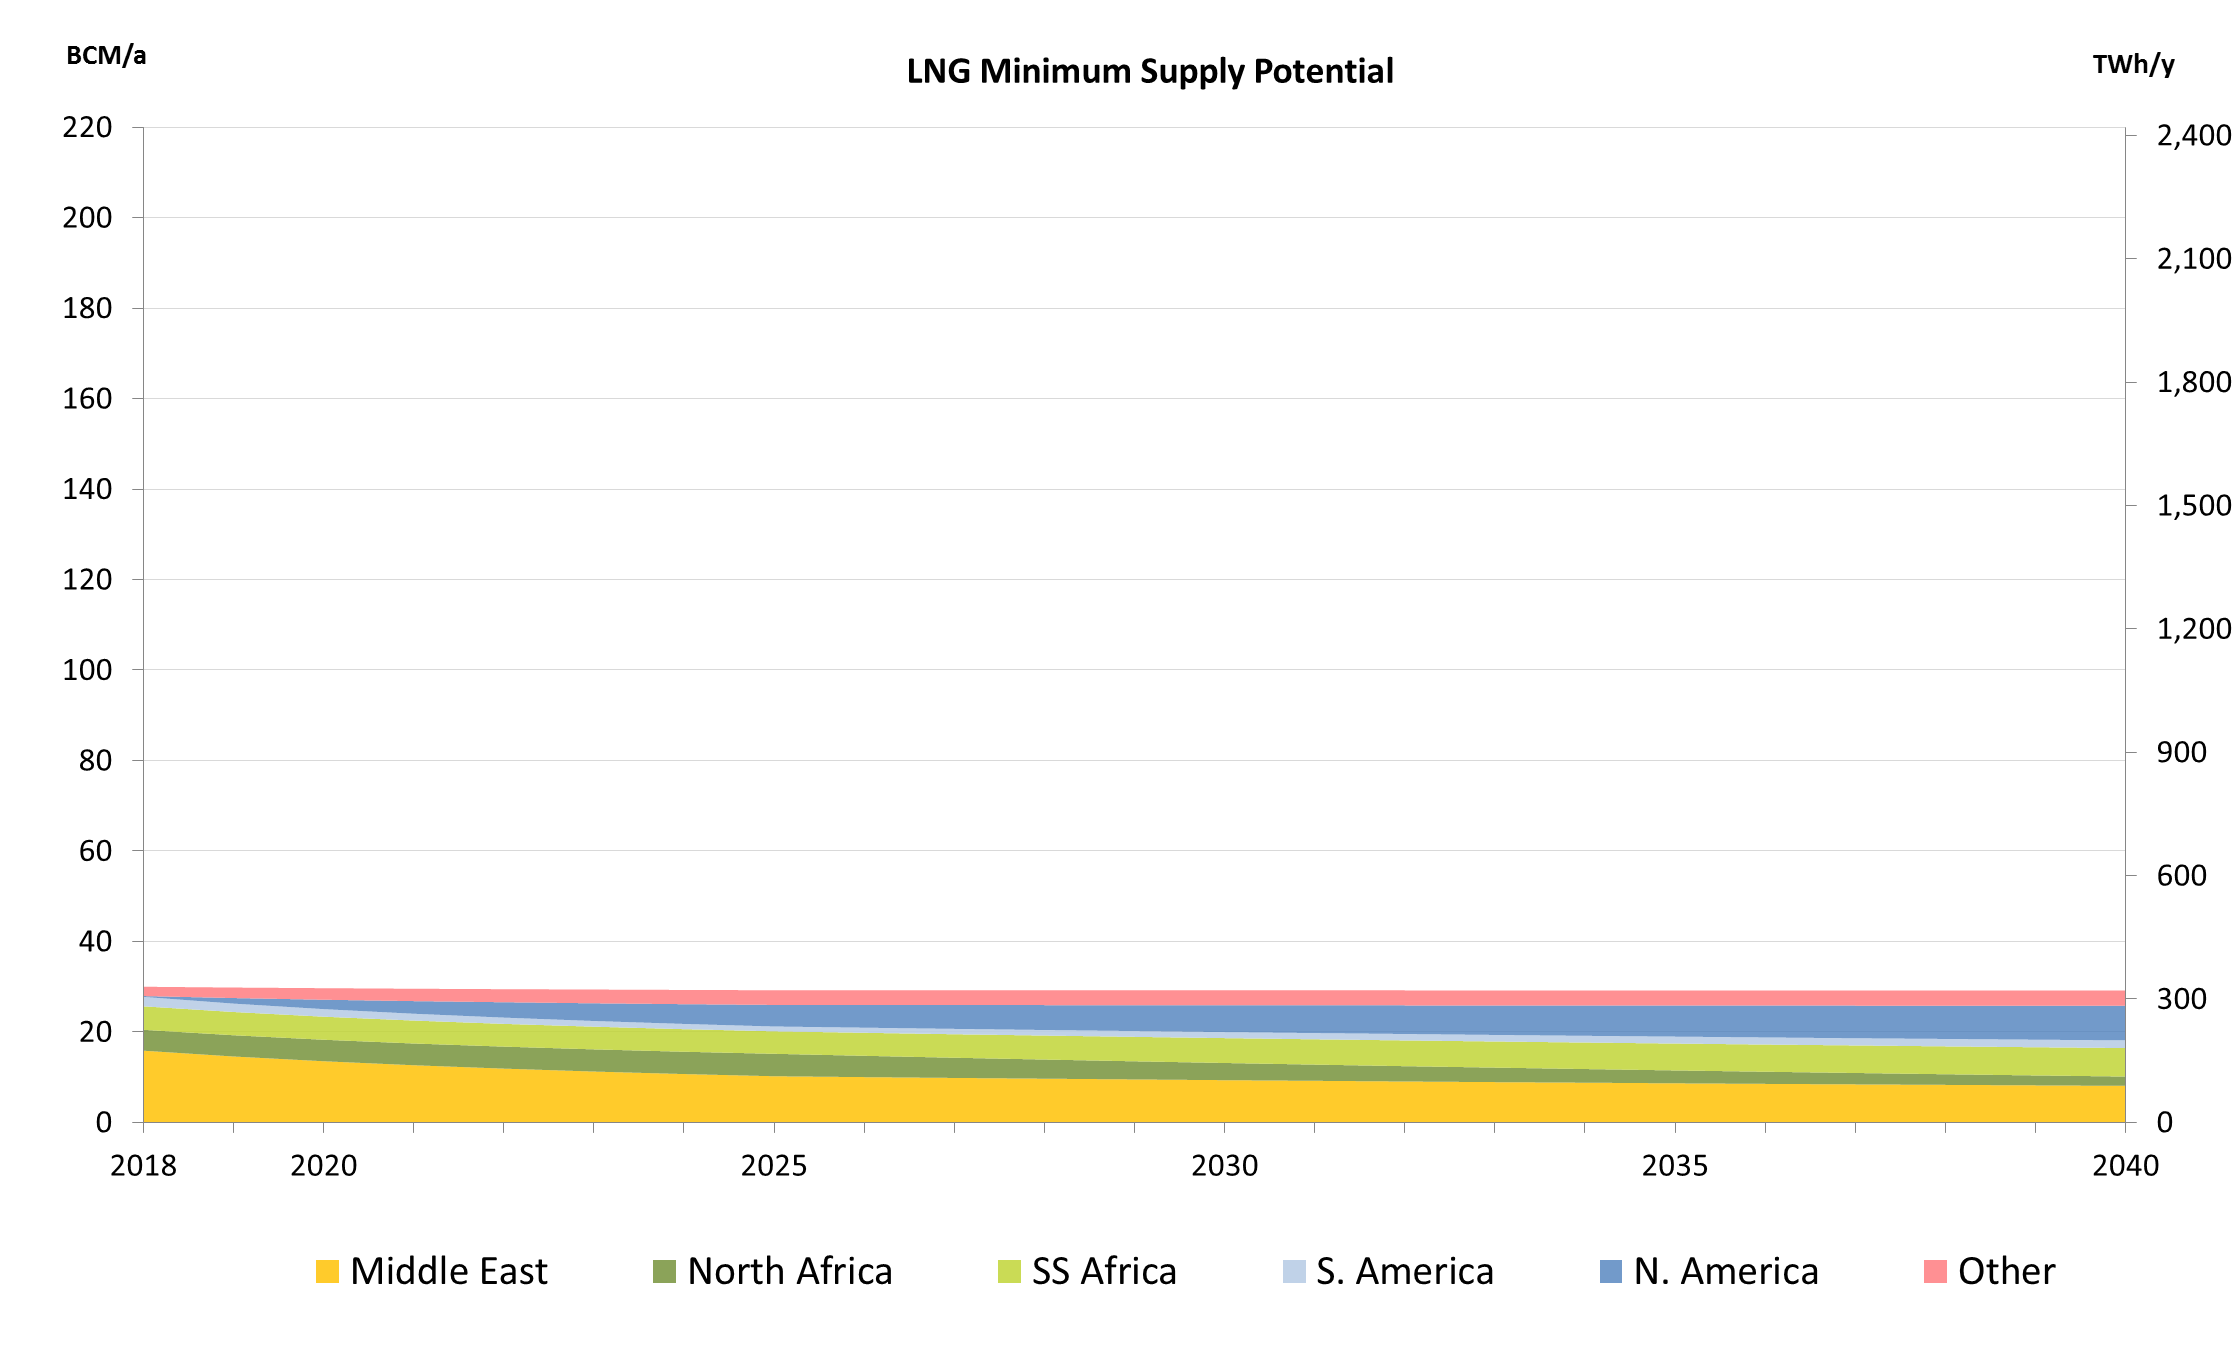
Figure 47: Minimum LNG potential
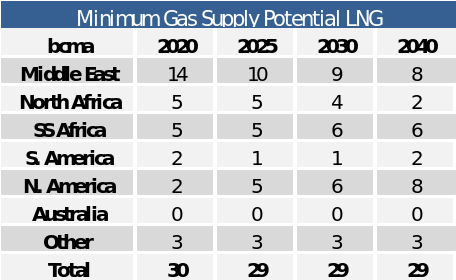
Table 8: LNG minimum potentials (bcma)