Fuel prices that change depending on the scenario
World energy fuel prices for oil, gas and coal are typically hard to predict. The IEA World Energy Outlook provides an annual report on the possible future energy trends and the associated fossil fuel and carbon prices for the 2020 to 2040 time frame.
The World Energy Outlook does not provide the price of commodities in the format for the market study tools. The World Energy Outlook does, however provide conversion tables to calculate the fuel prices in €/GJ.
The following conversion tables are extracted from the WEO2016:
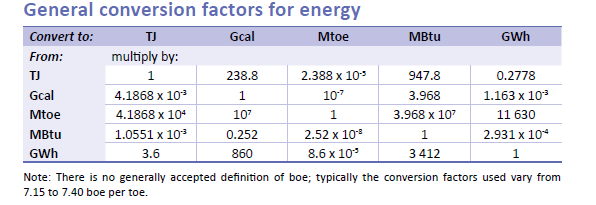
Table 2: WEO 2016 conversion factors for energy
The World Energy Outlook provides fuel prices in USD dollars, so for the purposes of modelling the European power market it is necessary to use the appropriate exchange rate, see following table:
Table 3: WEO 2016 currency conversion
The World Energy Outlook 2016 provides fuel prices for 2015, 2020, 2030 and 2040, see extracts from report for fuel prices and carbon prices. To derive the fuel and carbon prices for 2025 a linear interpolation is necessary.
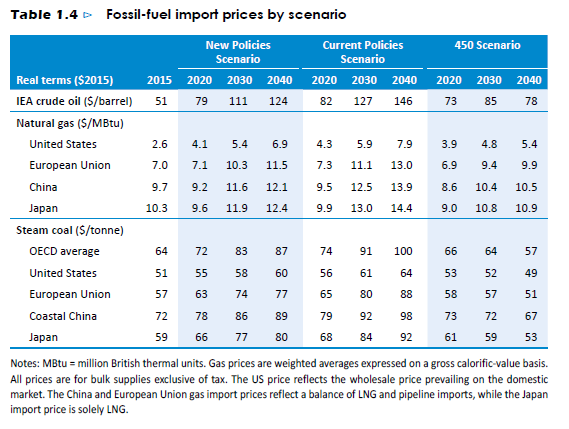
Table 4: WEO 2016 Fossil fuel import prices
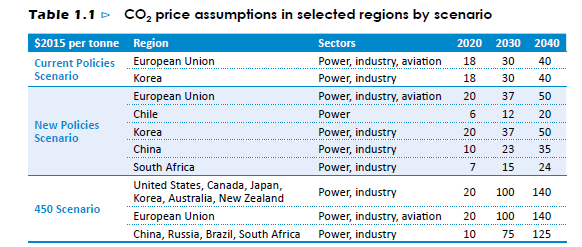
Table 5: WEO 2016 CO~2~ price assumptions
The storylines for each ENTSO scenario is used to map the World Energy Outlook scenario to the respect ENTSO counterpart. The WEO 2016 report, which has three scenarios (Current Policies, New Policies, 450 Scenario) which are described in further detail below. In order to derive the fuel prices for Sustainable transition, data was used from the Low Oil Scenario that was present in the WEO 2015 report. The fuel prices for the EUCO 2030 scenario are provided directly by DG Energy.
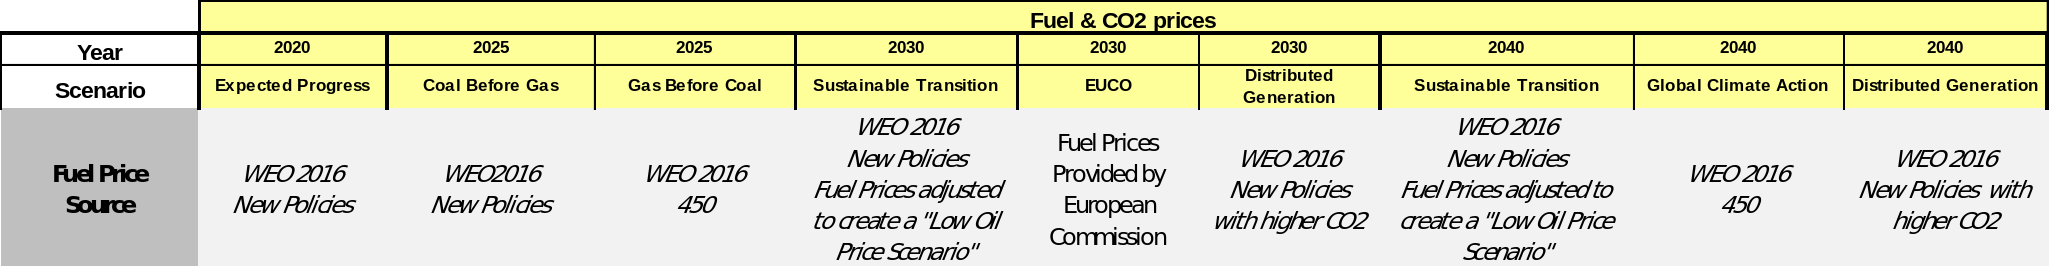
Table 6: Fuel & CO~2~ price assumption scenario alignment
[taken from IEA website]
- New Policies Scenario of the World Energy Outlook broadly serves as the IEA baseline scenario. It takes account of broad policy commitments and plans that have been announced by countries, including national pledges to reduce greenhouse-gas emissions and plans to phase out fossil-energy subsidies, even if the measures to implement these commitments have yet to be identified or announced.
- Current Policies Scenario assumes no changes in policies from the mid-point of the year of publication (previously called the Reference Scenario).
- 450 Scenario sets out an energy pathway consistent with the goal of limiting the global increase in temperature to 2°C by limiting concentration of greenhouse gases in the atmosphere to around 450 parts per million of CO~2~.
Scenarios that are directly mapped to World Energy Outlook 2016 or DG Energy fuel prices
1) 2020 Expected Progress
2) 2025 Expected Progress Coal before Gas
3) 2025 Expected Progress Gas before Coal
4) 2030 EUCO mapped directly to DG Energy
5) 2040 Global Climate Action
Scenario where WEO2016 scenarios are adapted to fit with the ENTSOs Storylines
1) 2030 & 2040 Sustainable Transition
a.  A ”Low Oil Price” Scenario generated from WEO2016 New Policies

b.  Setting the Merit order to Gas Before Coal
2) 2030 & 2040 Distributed Generation
a.  Based on WEO2016 scenario New Policies, carbon price adjusted to
    create an investment signal that enables developments in
    distributed generation technologies.

    1.  Fuel Price setting for 2030 & 2040 Sustainable Transition
Creating the 2030 and 2040 Sustainable Transition fuel prices is a two-step process:
Step 1 Creating the “Low Oil Price” Scenario
A “low oil price” scenario, and therefore low gas price, was developed for Sustainable Transition in order to reflect the storyline. The agreed process uses the methodology employed in the World Energy Outlook 2015 report. The WEO 2015 report uses scaling factors to adjust the new policies scenario for coal, gas and oil prices to create a Low Oil price scenario.
| Conversionfrom New Policies to Low oil fuel prices | “Low Oil Price” Scenario 2030 | “Low Oil Price” Scenario 2040 | |
|---|---|---|---|
| Hard Coal | 90 % | 2.4 €/GJ | 2.5 € /GJ |
| Gas | 80% | 7 €/GJ | 7.8 € /GJ |
| Light Oil | 70% | 15.2 €/GJ | 17.1 € /GJ |
Table 7: Conversion factors for Sustainable Transition prices
Step 2 Setting the Merit order to Gas Before Coal
The next step for alignment of the fuel prices to the Sustainable Transition 2030 and 2040 storylines is to set a gas before coal merit order. The method decreases the gas price in order that New CCGT Gas appears before Hard Coal New in the merit order.
| Horizon | Gas Adjustment Ratio to Achieve Gas before Coal | Final Gas Price for Merit order adjustment |
|---|---|---|
| Gas Price 2030 | 71 % | 5 € /GJ |
| GGas Price 2040as | 70% | 5.5.5 € /GJ5 |
Table 8: Conversion factors for Sustainable Transition merit order
- Fuel Price setting for 2030 & 2040 Distributed Generation
The fuel prices for Distributed Generation 2030 and 2040 are based on the World Energy Outlook 2016 New policies scenario.
The carbon price for the scenario is increased to €50/Tonne, in order that during the RES-E optimization and Thermal reduction process the correct investments signals are created to invest in distributed generation technologies
- Converting World Energy Outlook Fuel Prices to Power Market Fuel Prices
Oil (Light Oil and Heavy Oil)
Light and Heavy oil categories are thermal units used within the ENTSO-E power market tools. The reference Oil price is obtained from the World Energy Outlook scenarios. The €/GJ price for the Light and Heavy oil categories are calculated in accordance with conversion ratios that are linked to the oil fractioning process.
Conversion factors from Crude Oil to light oil and heavy oil:
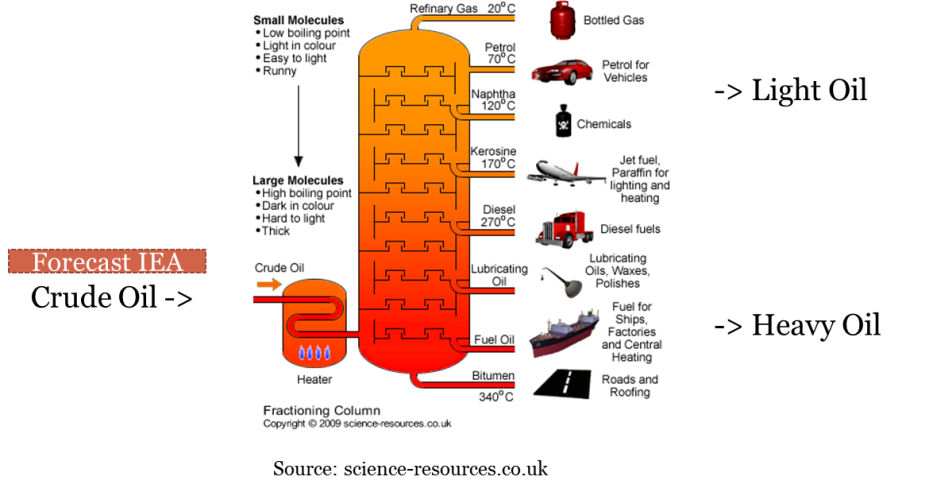
Figure 3: Crude oil conversion
Crude Oil -> Light Oil
Historic average. +28 % between crude and gasoline (Light Oil).
Source: https://www.eia.gov/dnav/pet/pet_pri_spt_s1_m.htm
Crude Oil -> Heavy Oil
Historic average. +5 % between crude and heating oil (Heavy Oil).
Source: https://www.eia.gov/dnav/pet/pet_pri_spt_s1_m.htm
Gas:
Gas prices are taken from the WEO. The MBTu to GJ conversion used is the one specified by the World Energy Outlook table of energy conversion.
Hard Coal:
Hard coal prices are taken from the WEO or DG Energy assumptions.
The coal calorific value of 25 GJ/ton is taken as conversion from the WEO prices. This is the calorific value used in Europe (CIF ARA 6000 NAR).
- CO~2~ price
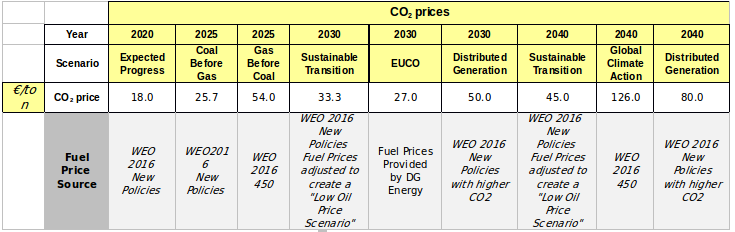
Table 9: CO~2~ prices by scenario
For most of the scenarios, CO2 prices are mapped to the World Energy Outlook 2016 or DG Energy Carbon prices:
1) 2020 Expected Progress
2) 2025 Expected Progress Coal before Gas
3) 2025 Expected Progress Gas before Coal
4) 2030 EUCO mapped directly to DG Energy
5) 2030 & 2040 Sustainable Transition
6) 2040 Global Climate Action
Scenario where WEO2016 scenarios were adapted to fit with the ENTSOs Storyline
1) 2030 & 2040 Distributed Generation (price to create an investment signal in distributed generation technologies)
1. Biofuel
Biofuel is either imported or taken from a local market. Subsidies in several countries exist leading to price differences between biomass/biofuel in Europe. As done in TYNDP 2016, the possibility of LAC to provide Biofuel data was made. The result in this collection is the following:
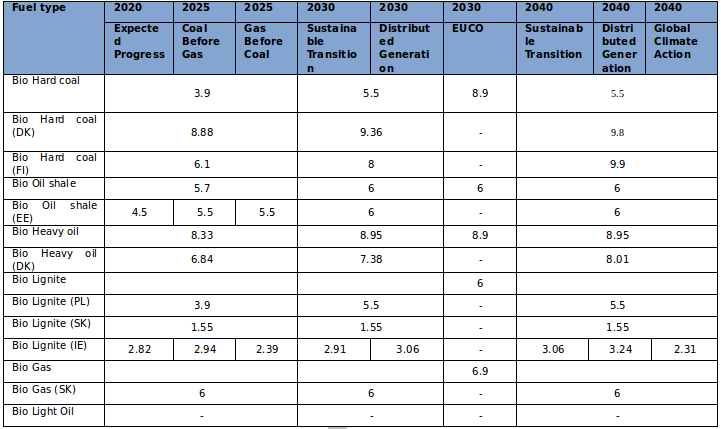
Table 10: Biofuel prices
For DK, FI, IE, PL and SK, the prices mentioned in the table above will be used for biofuel units (if specified in the “Thermal” sheet of the PEMMDB file). The unit’s characteristics are the same as the ones of the unit type where the biofuel is specified.