ENTSOG Processes
Natural Gas Indigenous Production and extra-EU Supply Potentials
This section provides a more detailed description of the various supply sources considered in the report. It is important to remember that, except for National Production, these results don’t represent fixed supply mixes in relation the main scenarios but only the range in which the different supply mixes will be assessed as part of the TYNDP simulations in order to achieve the final outcome.
Indigenous production
Indigenous production covers the national production of gas from EU countries including conventional sources and also the one from renewable gases including biomethane and power to gas.
Conventional sources
Conventional gas production in Europe has constantly decreased between 2010 and 2016. The evolution was not homogeneous and even if indigenous production increased slightly in some countries, the decreases observed in the Netherlands and the UK accounted for the majority of the decline in the EU over the period. The situation in the Netherlands is not only caused by depletion of gas reserves, but is also the result of several ongoing restrictions on the production of the Groningen field, introduced by the Dutch Government since 2014, in response to the earthquakes in the Groningen area.
The information on EU indigenous production has been collected from TSOs. The EU indigenous production is expected to continue decreasing significantly over the next 20 years. This decrease could be slightly mitigated with the development of production fields in the Romanian sector of the Black Sea and Cyprus. Next figure shows EU conventional production as foreseen by TSOs, including the one coming from Non–FID projects. Overall production could decrease by more than 60% by 2040 or even further if Non-FID developments are finally not commissioned.
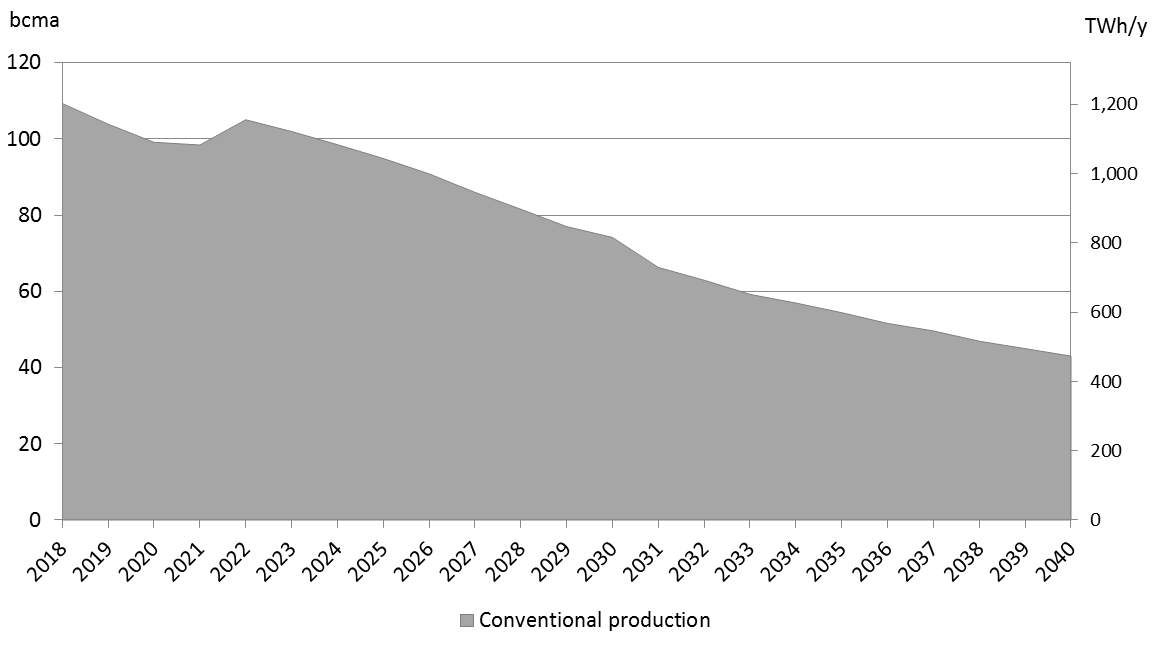
Figure 16: Potential of EU conventional production 2018-2040 (incl. Non-FID)
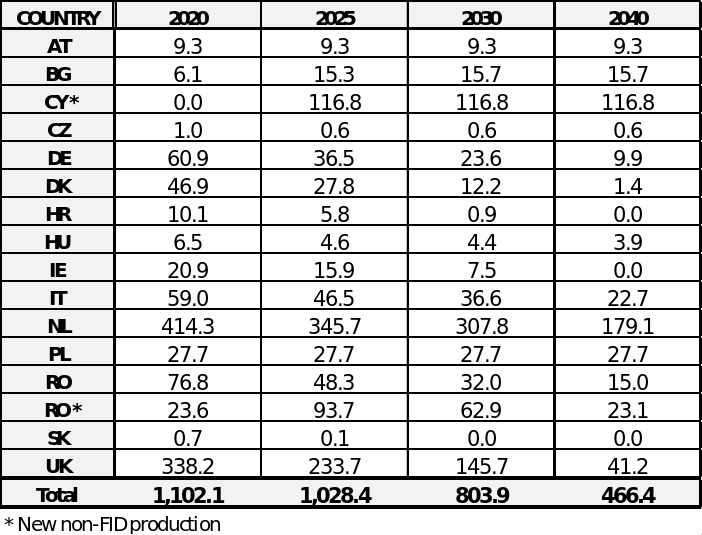
Table 19: Potential EU conventional production 2018-2040 (incl. Non-FID), TWh/y
Compared to imports, there is relatively little uncertainty on the evolution of European conventional production. The main uncertainty is related to the development of the necessary infrastructures to connect new gas fields to the rest of the European gas system.
- Renewable gases
Renewable gases include biomethane, hydrogen and synthetic methane produced with power-to-gas (P2G) technologies. They represent carbon neutral energies that can be produced continuously and injected or stored in the existing gas infrastructures.
- Biomethane
Biomethane’s chemical characteristics are the same of natural gas. It can be produced from all kinds of organic materials using digesters or capturing it directly in landfill sites. Liquid manure, agricultural waste, energy crops and effluent from sewage treatment plant can be fed into biogas plants.
Unblended biogas can be used for a range of applications including heating, cooling and power generation. Biogas can also be upgraded to biomethane (after removal of its high CO~2~ content) and be used in the transport sector, injected into the natural gas grids and storage facilities as its composition is similar to natural gas.
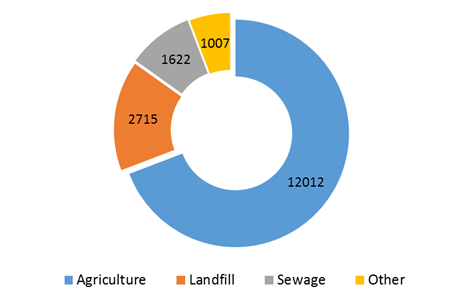
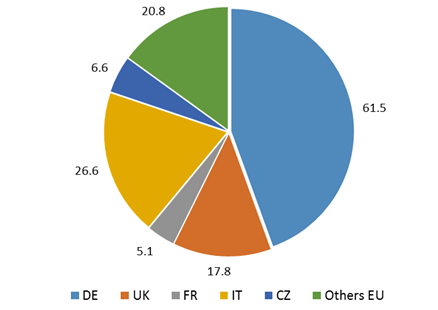
Figure 17 - European biogas plants and Biogas production in Europe 2015 (EBA)
The annual production in 2015 of unblended biogas in Europe was approximately 13 bcm in natural gas equivalent (138 TWh). Currently Germany, Austria and Denmark produce most of their biogas from agricultural plants whereas the UK, Italy, France and Spain predominantly use landfill gas. Out of this biogas production the biomethane output in 2015 was approximately 1.23 bcm (13.5 TWh), produced from over 459 upgrading plants with injection into the transmission or distribution grids in 15 countries.
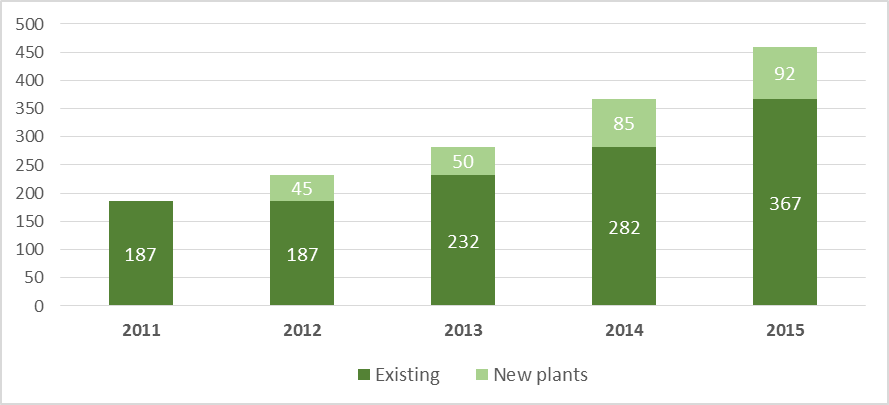
Figure 18: European biomethane plants 2015 (EBA)
- Biomethane supply potentials
Biomethane potentials only cover the share of biogas upgraded to biomethane as only this proportion can be injected into the distribution or transmission grids. According to the TSO estimates in the Global Climate Action, the largest share of biomethane injection in 2040 will take place in Italy, France, United Kingdom and the Netherlands accounting for over 90 % of biomethane supply in Europe.
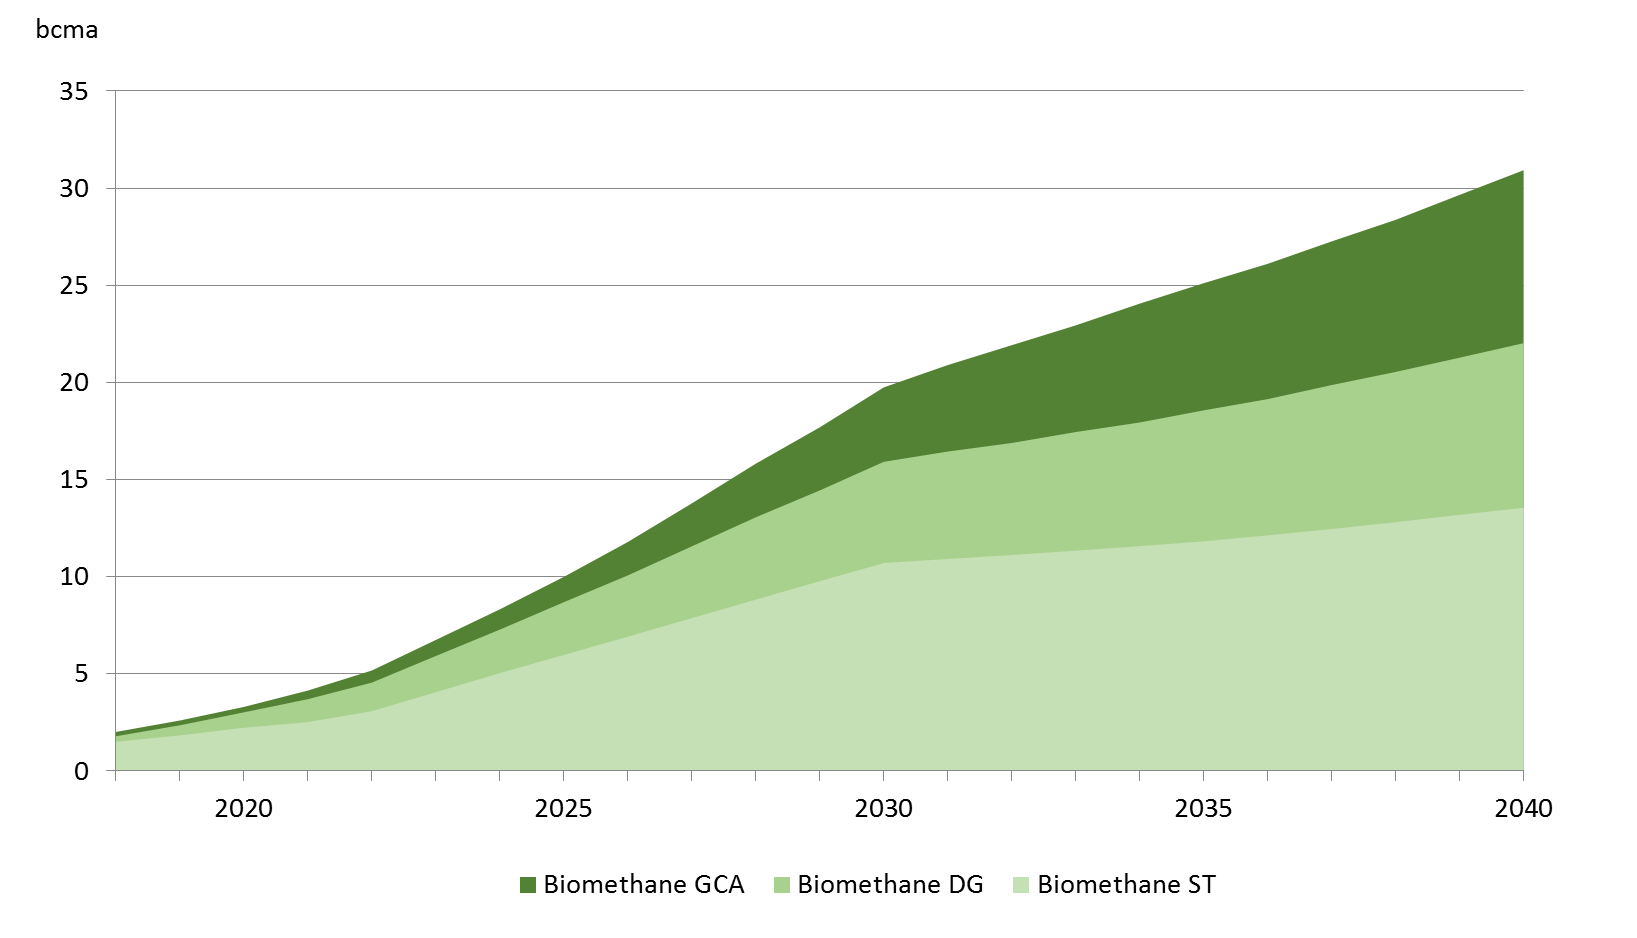
Figure 19: Potential EU biomethane production 2018-2040
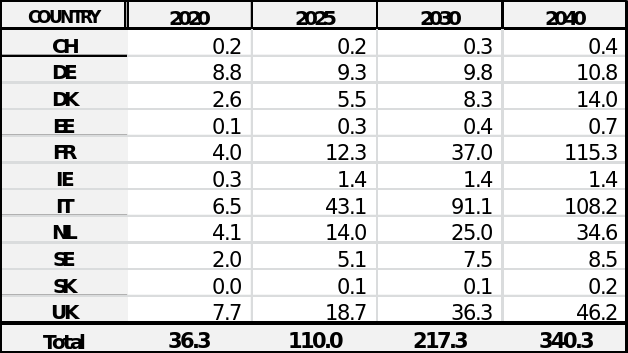
Table 20: Potential EU biomethane production 2018-2040 Global Climate Action, TWh/y
- Power-to-gas
Power-to-gas (P2G) is the name for a technology and process that converts electrical power into a gaseous energy. Through this process, the excess production of renewable electricity which would normally be curtailed or low lost electricity, can be used to produce hydrogen by electrolysis. This hydrogen can also go through a methanation process, using a source of CO2 to create synthetic natural gas (SNG) which can be injected into the transmission without any new requirements or modifications to the existing infrastructure. Production figures for P2G within TYNDP18 relate to SNG.
P2G does not only offer the possibility to store renewable energy but also to transport it over long distances by using the gas infrastructure. This source of green gas can be used to decarbonise sectors that will struggle to move to electrification. It also has the potential to provide a demand side balancing mechanism to the power system, plus could enable the installed capacity of renewable power generation to increase, along with the overall usage of renewable sources in the energy mix.P2G (power-to-gas including by hydrogen or methane injection) is a technology allowing to foster the convergence of energy systems, utilising the respective strengths of each.
Methodology: Based in the P2G figures provided to ENTSOG by GRT Gaz for France and Energinet for Denmark, P2G potential technical capacities where estimated for the other countries by assessing the P2G capacity in the assumptions for the Solar and Wind capacities estimated and fixed in 2030 and 2040 for GCA and DG. The production per country is estimated taking into account the outcome of the electricity curtailment and the marginal price output in 2030 and 2040 of GCA and DG scenarios.
The potential for P2G has been based on the output of the ENTSO-E market models. Further optimisation loops would be required in order to fully assess the full impact of P2G capacity on the respective networks. When assessing the GCA generation using the 2030 Reference Grid results in curtailed energy which could be utilised by P2G installations. However, part of this curtailment could be avoided with additional electricity interconnectors.
Another aspect involves taking into account the price of natural gas and CO2, producing renewable gas as a product for less than 30 eur/MWh could provide a business case for P2G if sites can be operated for 3,000 hours per year.
General assumptions:
Efficiency AC power to synthetic CH4: 65%
Average running hours: 3,000
Production electricity price under 30 eur/MW
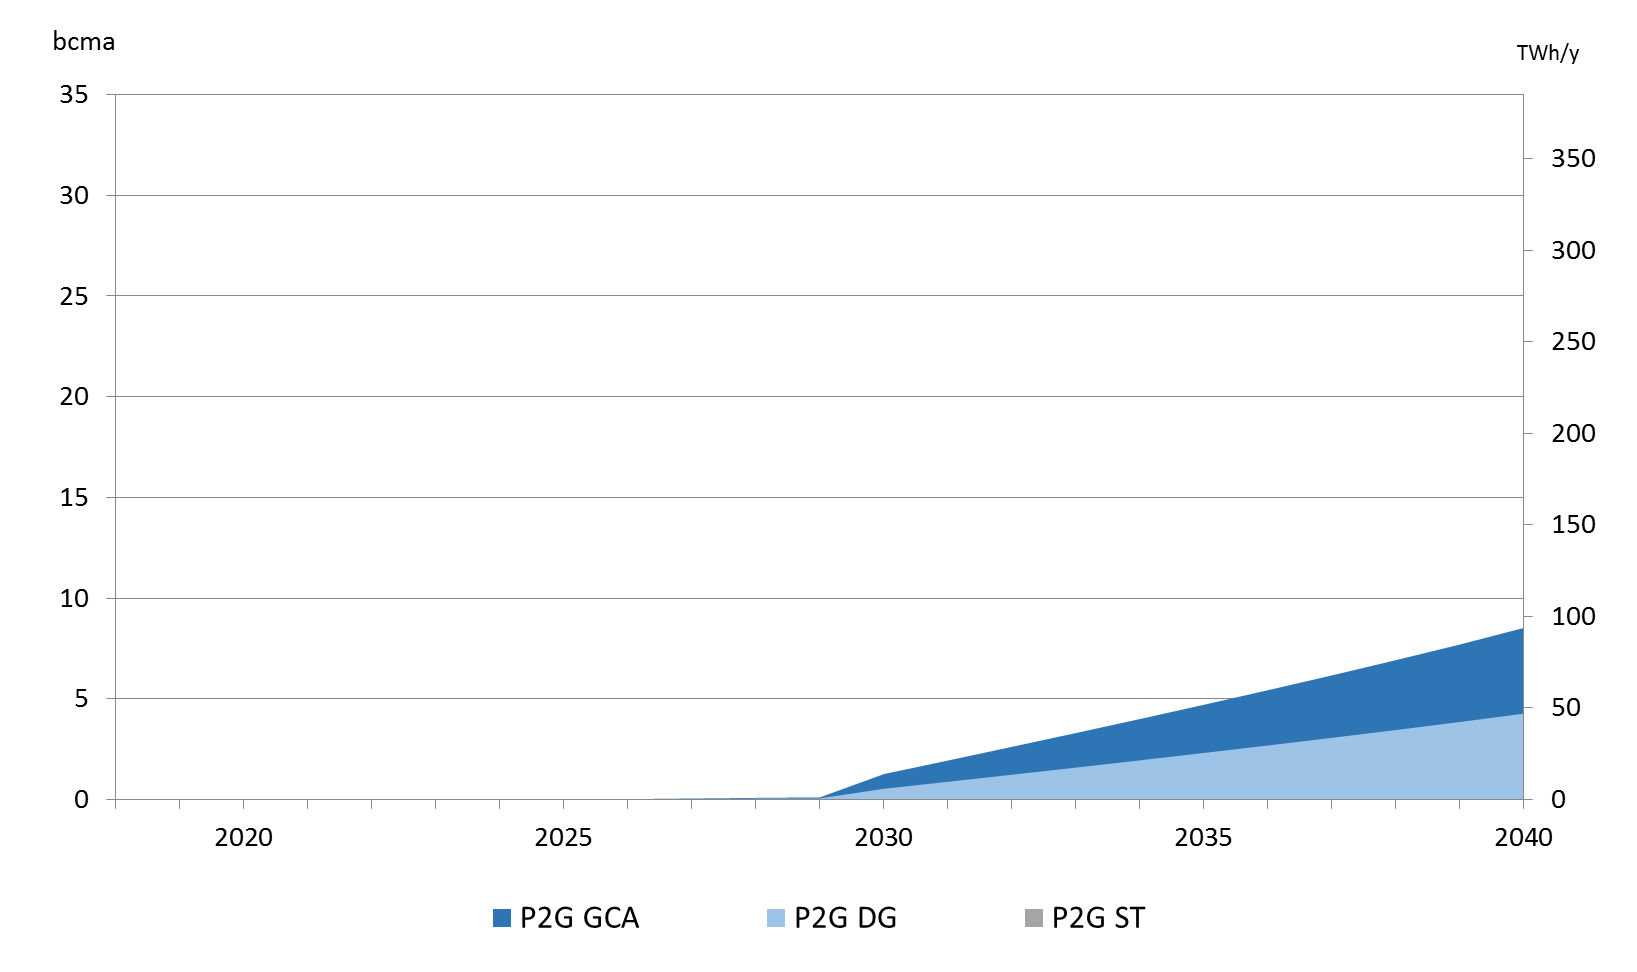
Figure 20: Potential EU power-to-gas production 2018-2040
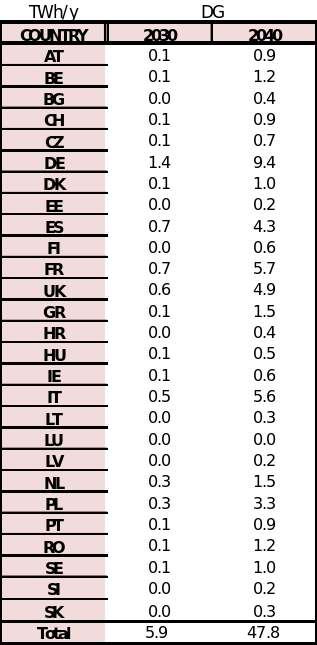
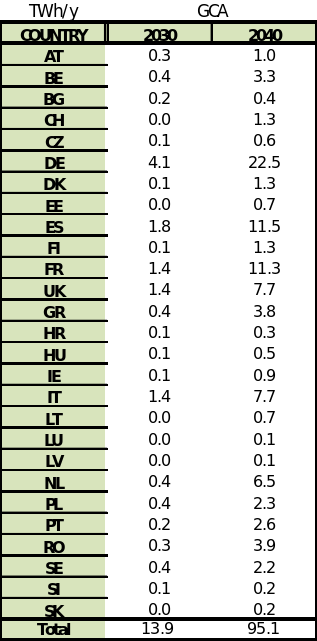
Table 21: Potential power-to-gas production 2030-2040 DG and GCA
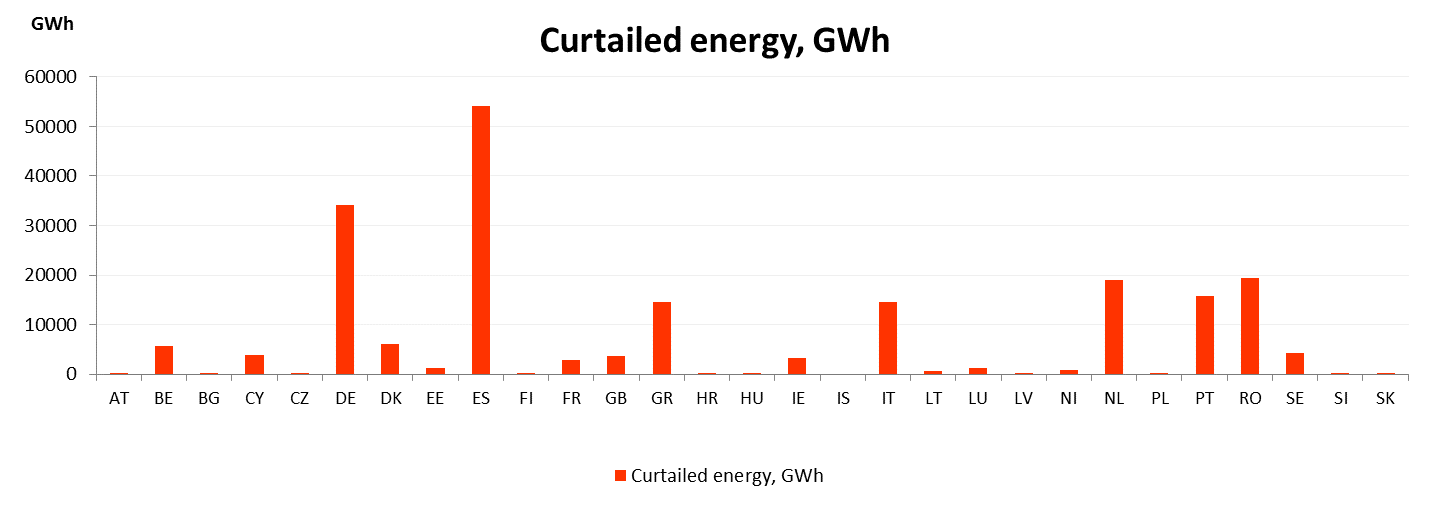
Figure 21: Curtailed Energy 2040 GCA
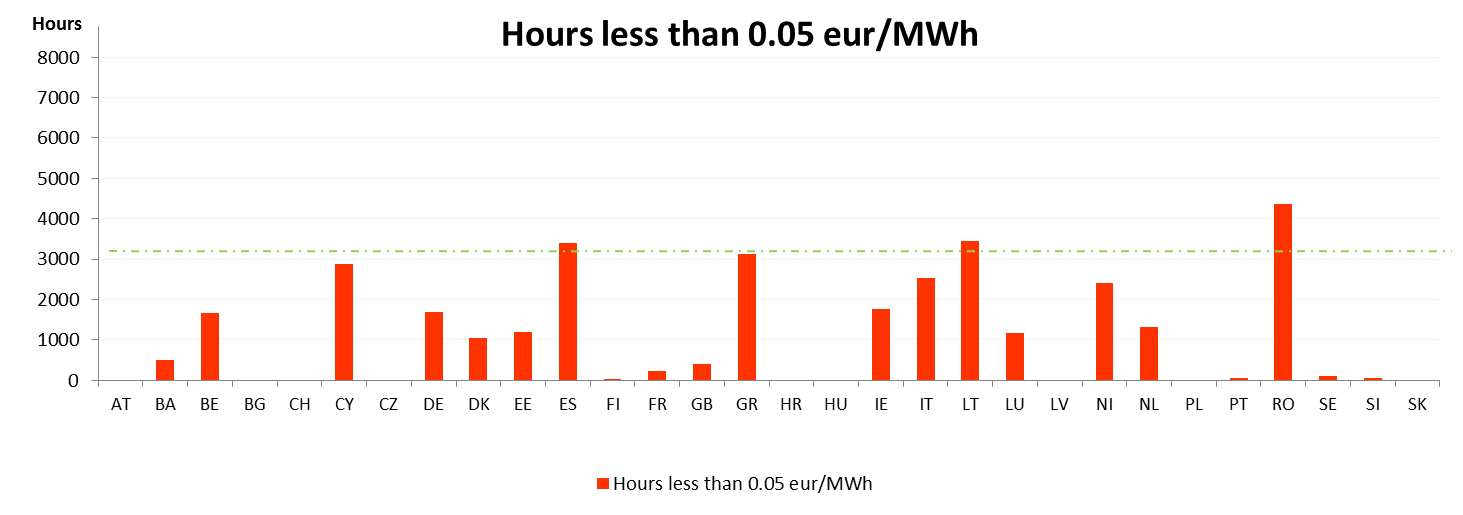
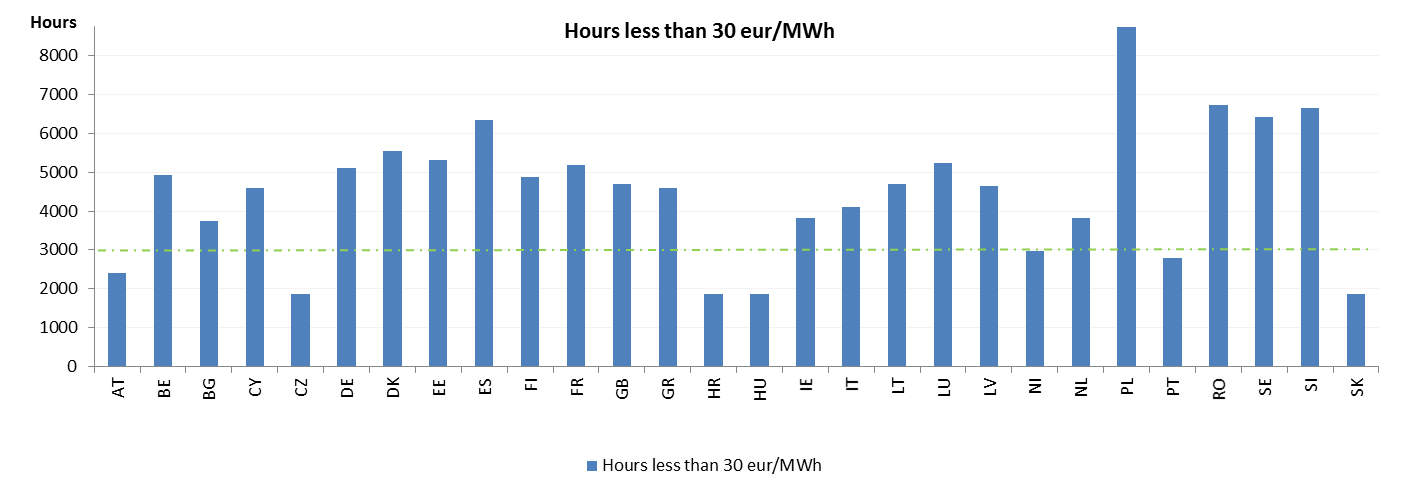
Figure 22: Number of hour’s marginal price under 0.05 and 30 eur/MW 2040 GCA
- Russia
The Russian Federation is currently the main gas supplier of the EU, providing by pipeline 143 bcm (1,573 TWh) in 2016, more than 30% of EU supply share. It is expected to remain a major import source over the whole time horizon of this Report.
- Reserves
Russia has the second largest proven gas reserves in the world, behind Iran, with 32,271 bcm at the end of 2016, increasing for around 14 % between 2000 and 2016. According to Gazprom most of the production and reserves are located in the Ural Federal District, with significant reserves also in the continental shelf.
- Production
Russia has been the second largest natural gas producer of the world in 2016 behind the United States of America with 579.4 bcm.
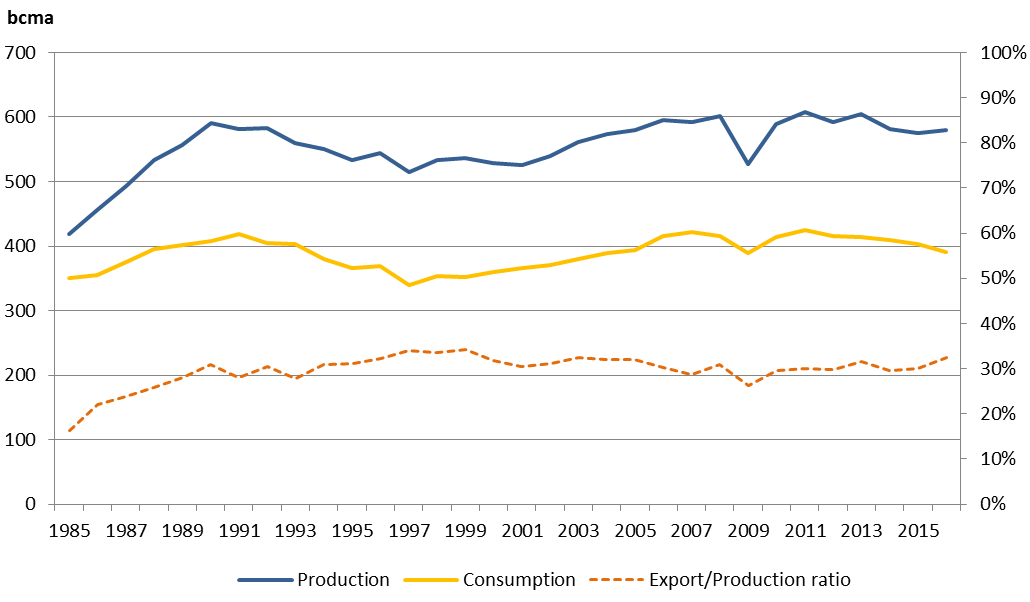
Figure 23 - Natural gas production and demand of Russia (source BP statistical review 2017)
In the period 2005-2016 the natural gas production of Russia has remained relatively stable, except for in 2009 with a decrease that could be linked to the economic down-turn and the Ukraine transit disruption, reaching even more than 600 bcm some years. Russia has its own domestic demand that can influence its export potential. This internal demand of Russia has remained above 400 bcma since 2011 but with a stable descending trend down to 391 bcm in 2016.
- Exports
Gas is exported to Europe through three main pipelines :
The Ukrainian route is the largest gas pipeline route from Russia to EU (enter IPs to Slovakia, Hungary, Poland, Romania) transiting through Ukraine. The total annual capacity is around bcma. Urengoy-Pomary-Uzhgorod pipeline which is a part of the route entered into operation in 1967.
Yamal-Europe I: Entered in operation in 1994 and transmits gas along 2,000 km to Poland and Germany via Belarus. Its annual capacity is around 33 bcma.
Nord Stream: Twin offshore pipeline across the Baltic Sea with the first line established in 2011, and the second one in 2012. It transmits gas along 1,220 km between Vyborg (Russia) and Greifswald (Germany) with two lines of 27.5 bcma each.
On April 2017 the financing agreements for the Nord Stream 2 gas pipeline project was signed. Similar to the first two strings, the new ones will be laid from the Russian coast via the Baltic Sea to Greifswald. The capacity of the new gas pipeline will reach another 55 bcma and it is expected to enter service by the end of 2019.
Also, TurkStream construction commenced on May 2017 in the Black Sea, near the Russian coast. The offshore part of the pipeline will reach a maximal depth of 2,000 meters and a length of 910 kilometres to supply Turkey and neighbouring EU region with 31.5 bcma.
Other export gas pipelines of Russia bring gas to other non-EU markets:
Blue Stream: A 1,210 km-long gas offshore pipeline directly connecting Russia to Turkey across the Black Sea. It came on line in 2003 and its annual capacity is around 16 bcma.
North Caucasus: Carries Russian gas to Georgia and Armenia and its annual capacity is around 10 bcma.
Gazi-Magomed-Mozdok: it traverses 640 km through Russia and Azerbaijan. Initially this pipeline was used to export Russian gas to Azerbaijan, but it has been reversed and from 2010 it can carry 6 bcma of gas from Azerbaijan to Russia.
The largest recipients of Russian gas via pipeline in the European Union are Germany and Italy. In 2016, these two countries imported almost half of the Russian into the EU. Outside the European Union the largest recipients of Russian gas were Turkey (23.2 bcm) and Belarus (16.6 bcm).
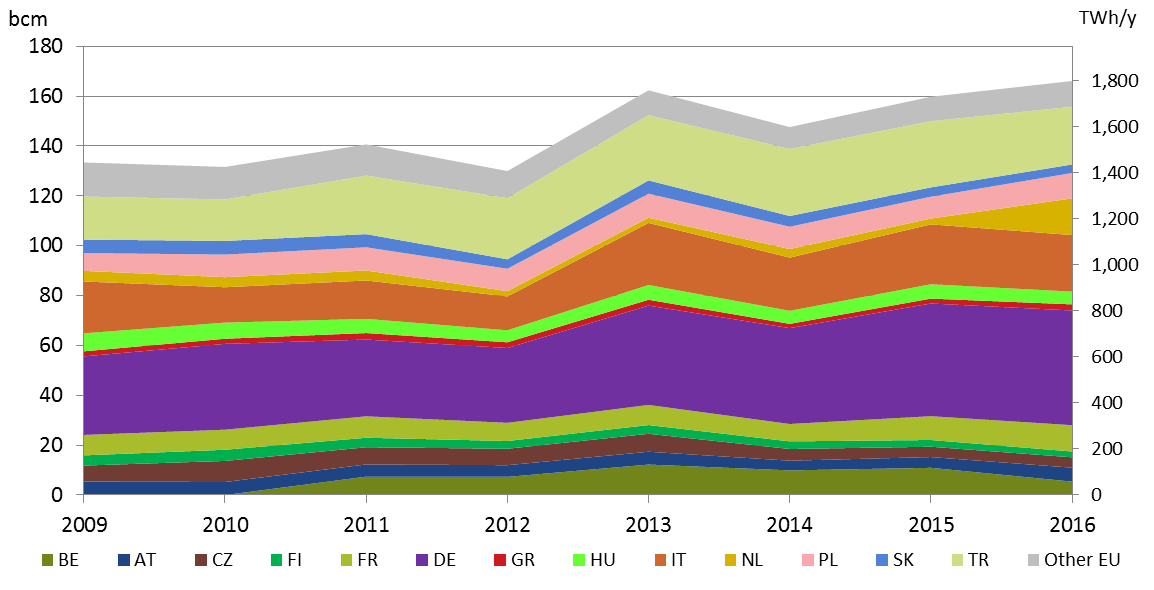
Figure 24 – Russian natural gas trade movements by pipeline, source BP statistical reviews 2010-2017
Russia is extending its interest also to eastern markets and signed a supply contract with China to deliver 38 bcma of natural gas as of 2020 via the 4,000 km long Power of Siberia pipeline that runs to the Russian-Chinese border with the design capacity of 61 bcma.
Besides the gas exports via pipeline, Russia is also an exporter of LNG. The Sakhalin liquefaction plant was commissioned in 2009 and in 2016 Russia exported 14 bcm of LNG, the majority of which was exported to Japan and South Korea. However, it is still a small amount in comparison to the EU pipeline-bounded gas exports. The Yamal LNG plant could increase the LNG exports of Russia to Europe, it will be built in three phases which are scheduled from start-up in 2017 to 2019. The project will be able to produce around 22.6 bcma f LNG which will be probably shipped to Asia-Pacific and European markets.
The future of EU imports of Russian gas will basically depend on the European demand level, on the competition from other big consumers in Asia to import Russian gas and the amount of investment in the upstream sector.
- Norway
Norway is currently the second largest gas supplier of the EU and in 2016 provided gas deliveries via pipeline of 110 bcm (1,210) TWh. It is expected to remain a key import source. Contrary to Russia, Norway has no domestic demand that could influence its export potential, however, there is still uncertainty over the volume of Norwegian gas that can be produced from existing fields which are in decline. This means that new exploration, production and upstream pipeline investments are required to maintain the volumes produced currently. The potential for this development may also vary depending on market conditions.
As show in the next table, Norwegian gas is exported via a well-developed offshore pipeline network that connects to Germany, UK, France, the Netherlands and Belgium.
| Pipeline | Country | Capacity (M sm3/d) |
|---|---|---|
| Europipe | Germany | 46 |
| Europipe II | Germany | 71 |
| Franpipe | France | 55 |
| Norpipe | Germany, The Netherlands | 32 |
| Tampen Link | UK | 10-27 |
| Vesterled | UK | 39 |
| Zeepipe | Belgium | 42 |
| Langeled | UK | 72-75 |
| Gjøa Gas Pipeline | UK | 17 |
Table 22 - Export capacity of the GASSCO offshore system, (Source GASSCO website)
In addition to the direct import countries shown in table 3 above, the Norwegian gas is also transited through the pipeline network across Europe (as shown in next figure).
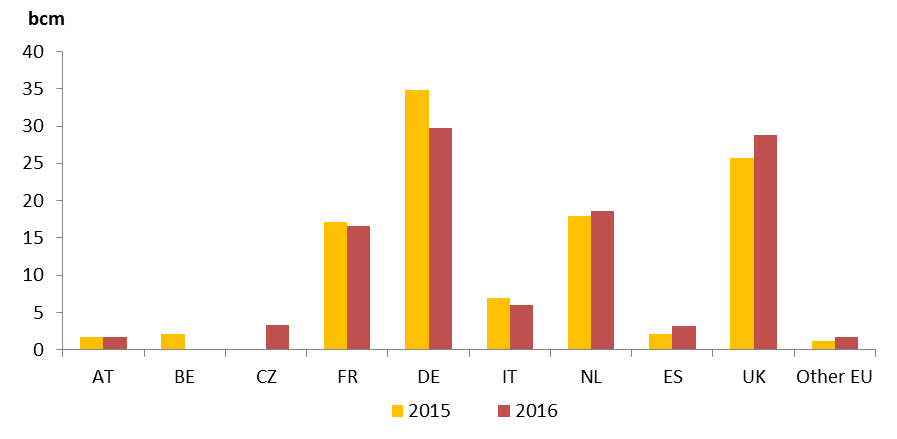
Figure 25 - Norwegian pipeline exports by destination in 2015-2016 (source BP Statistical Review 2017)
- Reserves
Norway has been supplying natural gas to Europe for more than 40 years since production began in the early 1970s. Since then, the development of new fields has enabled the continuous increase of gas volumes exported by Norway. However for the past decade the sold and delivered volumes have increased faster than new discoveries have progressed (Reserves and contingent resources). Roughly half of the reserves still remain but the overall production could fall below current levels during the 20 year time horizon.
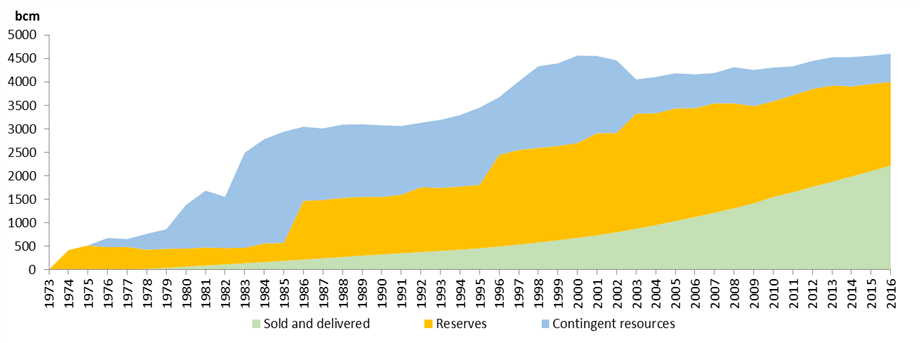
Figure 26 - Evolution of Norwegian gas reserves 1973-2016 (Source Norwegian Petroleum Directorate)
One of the main challenges for Norway is to decide about the most beneficial way to export the future production. It is not decided yet whether to expand the offshore network to connect new fields to the existing grid and export this production to Europe or to export LNG globally. However, for this solution to materialize, strong signals from European market are required.
- Algeria
Algeria is one of the main producers in Africa and currently the third largest gas supplier to Europe by pipeline and also when considering both pipeline and LNG. In 2016 Algerian pipelines provided to Europe around 32.5 bcm (358 TWh), around 8% of the EU supply share. Algeria is expected to play an important role as gas exporter also in the future. However the availability of Algerian gas will depend on future production developments and competition between pipeline gas and the global LNG market.
- Reserves
With its 4,500 bcm (49,500 TWh) of proven natural gas reserves Algeria ranks in the top ten of countries with the largest gas reserves in the world and is the second largest in Africa after Nigeria. More than half of the reserves (2,400 bcm - 26,400 TWh) are located in the centre of the country to the northwest, in the Hassi R’Mel field. The rest of the reserves come from fields situated in the Southern and South-eastern parts of the country. Besides that, Algeria holds vast untapped unconventional gas resources, According to an EIA study Algeria is after China and Argentina the third-largest country worldwide with 20 Tcm of technically recoverable shale gas resources.
- Production and Consumption
Since some of the Algerian largest gas fields have begun to deplete, Algeria aims to bring new gas fields on stream but many of those projects have been postponed because of delayed governmental approval, difficulties in attracting investment partners and technical problems. Algeria’s state energy producer Sonatrach Group plans to increase output of natural gas and crude oil by 20% in the next four years as new projects start up.
| Project name | Partners | Output (bcma) | Start year |
|---|---|---|---|
| In Salah (Expansion) | BP/Sonatrach | 14.0 | 2016 |
| Touat | Engie/Sonatrach | 4.3 | 2016 |
| Reggane Nord | Repsol/Sonatrach/DEA/Edison | 4.3 | 2017 |
| Timimoun | Total/Sonatrach/Cepsa | 1,8 | 2017 |
| Ahnet | Total/Sonatrach/Partex | 3.9 | 2018 |
| Hassi Ba Hamou | Sonatrach | 1.4 | 2018 |
| Hassi Mouina | Sonatrach | 1.8 | Tdb |
| Isarene (Ain Tsila) | Petroceltic/Sonatrach | 3.6 | 2018 |
| Tinhert, Illizi basin | Sonatrach | 9.3 | 2018 |
| Menzel Ledjmet SE | Sonatrach | 4.3 | 2019 |
Table 23– Algeria’s upcoming natural gas projects, source EIA 2016, country report Algeria.
Natural gas production shows uncertainty in the short-term and may recover in the mid-term. On the other hand, domestic gas consumption in Algeria is increasing and shows an ongoing upward trend that could influence its export potential.
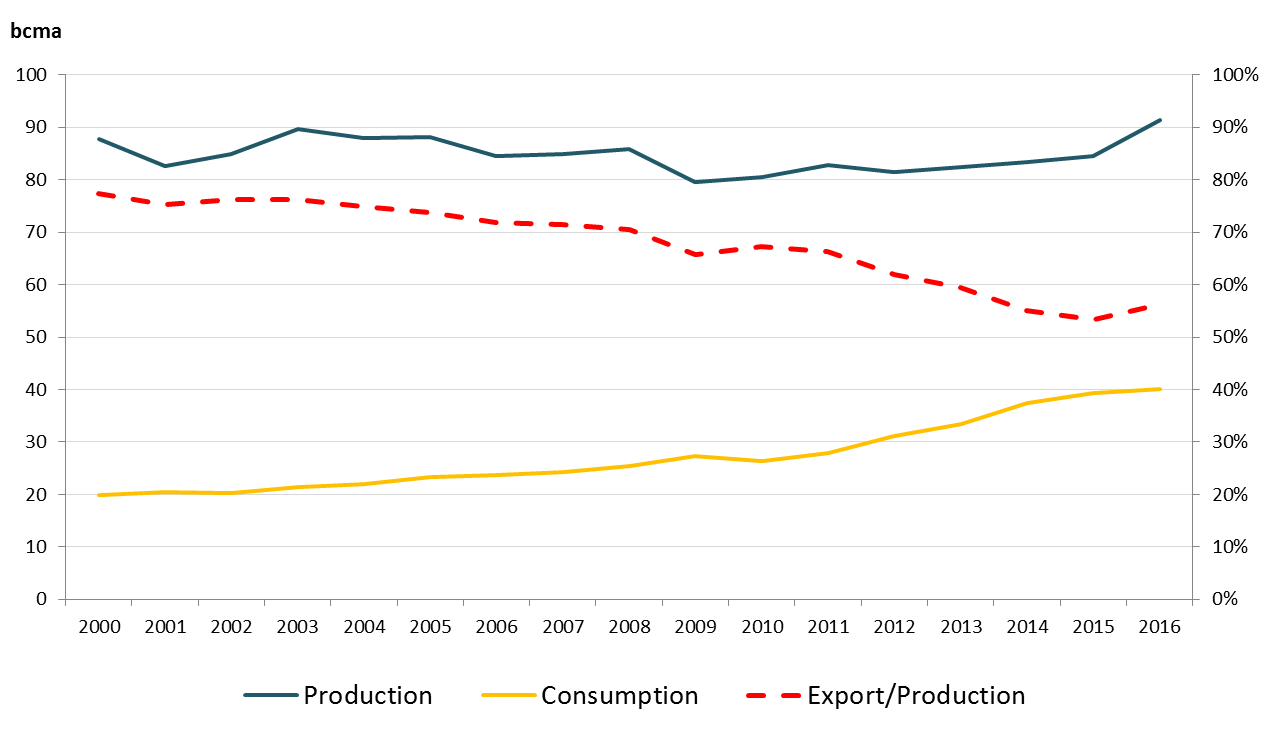
Figure 27 – Algerian dry natural gas production and consumption (source BP Statistical Review 2017)
Exports
- Pipelines
Gas is exported to Europe via three main pipelines crossing the Mediterranean Sea:
Pipeline Enrico Mattei (GEM), it came on line in 1983 and transports gas along 1,650 km from Algeria to Italy via Tunisia. According to Sonatrach, its capacity is around 33 bcma
MEG pipeline came on line in 1996 and transports gas along 520 km to Spain via Morocco. Its capacity is around 13 bcma
MEDGAZ pipeline came on line in 2011 and transports gas along 200 km onshore and offshore, from Algeria to Spain. Its capacity is around 9 bcma
In 2016 Algeria exported 32.5 bcm to Europe via pipeline, 53% to Italy, 36% to Spain, and 11% to other EU Countries via either Spain or Italy.
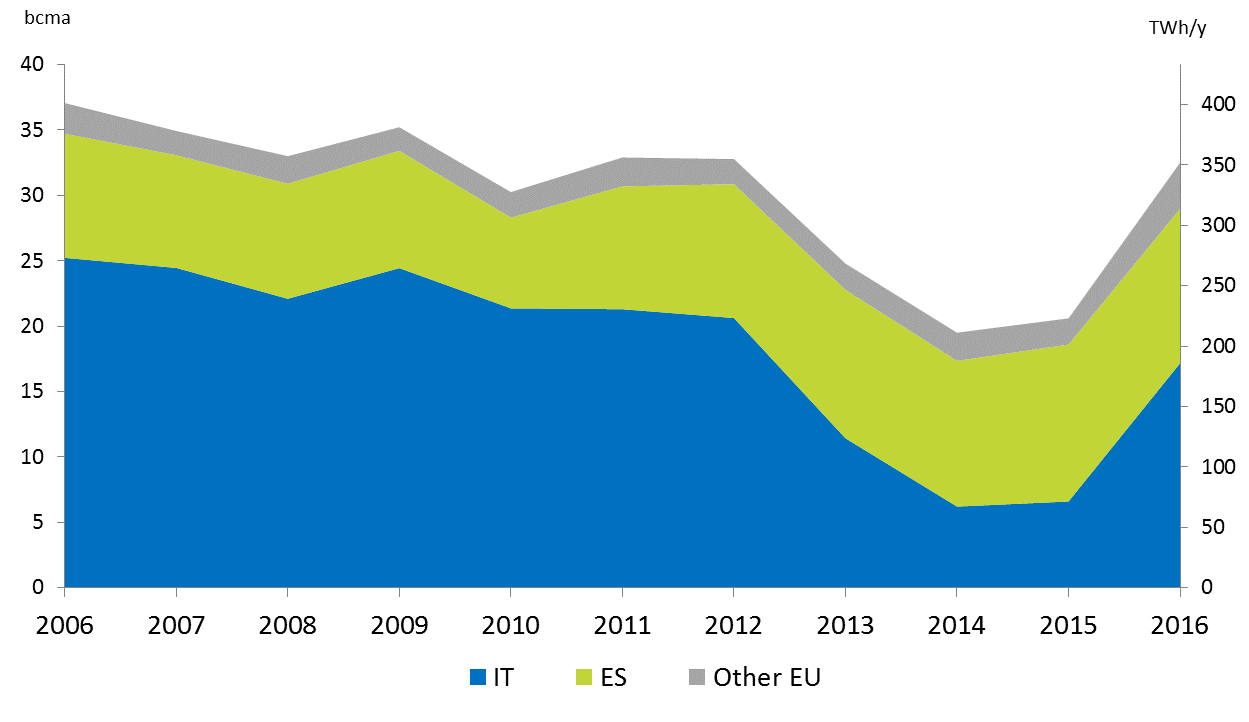
Figure 28 - Algerian pipeline gas exports to Europe (2006-2016). Source BP statistical review 2017
With the commissioning of the MEDGAZ pipeline in 2011 Algerian exports to the Iberian Peninsula increased while flows towards Italy declined from 2013 to 2015 due to the renegotiation of long-term contracts between ENI and Sonatrach.
This represents the challenge for Algeria of developing gas production facing both national demand and export expectations.
- Libya
Libya is currently the smallest gas supplier of the EU via pipeline. In 2016 it provided to Europe around 4.4 bcm (48 TWh), 1% of the supply share. This is expected to remain almost unchanged along the time horizon of this Report.
- Reserves
With its 1,500 bcm (16,500 TWh) of proven natural gas reserves Libya ranks among the African countries with the largest gas reserves of the continent. Prior to the civil turmoil, which has continued since 2011, new discoveries and investments in natural gas exploration had been expected to raise Libya's proved reserves but for the moment this has not occurred.
- Production
Most of the country’s production is coming from the onshore Wafa field as well as from the offshore Bahr Essalam field. Production grew substantially from 5.5 bcm (59 TWh) in 2003 to nearly 17 bcm (187 TWh) in 2010. In 2011 Libyan production was almost entirely shut down due to the civil war. Compared to 2010, more than a 50 % drop was registered, with the production decreasing to 8 bcm (88 TWh). According to BP Statistical Review, natural gas production recovered to 12 bcm in 2015 but decreased again last year to approximately 10 bcm (110 TWh/y) in 2016.
- Exports
Piped exports are transported via the Green Stream pipeline which came online in 2004. This 520 km offshore pipeline connects Libya to Italy through Sicily. This infrastructure has a total capacity of around 12 bcma.
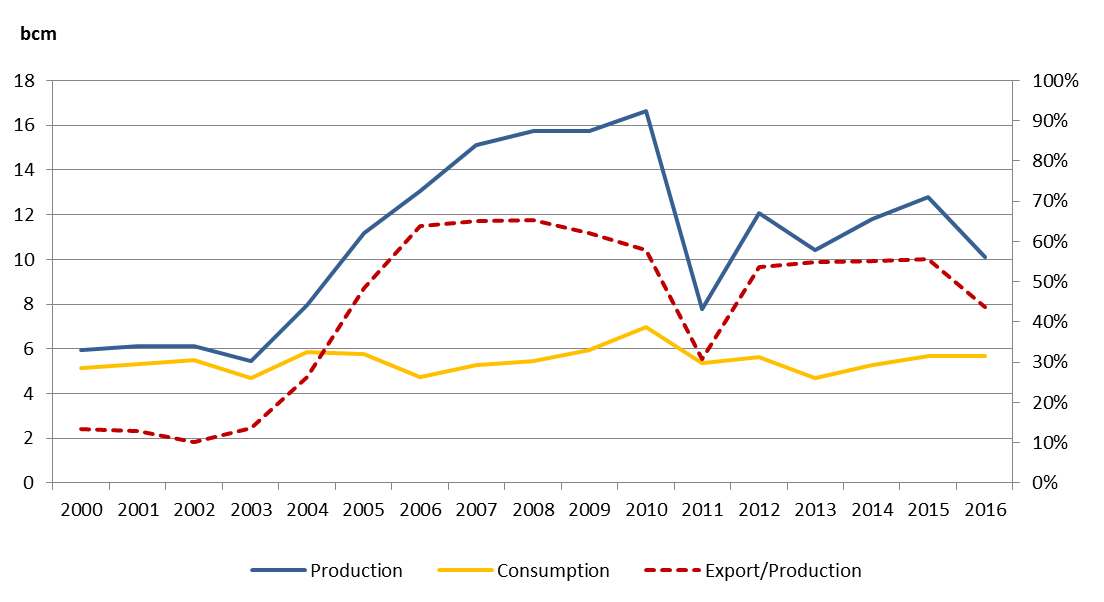
Figure 29 - Libyan gas production, consumption and export ratio 2000-2016. Sources BP statistical review 2017.
From March to mid-October 2011 Libyan exports to Italy were completely interrupted due to the civil turmoil. Exports soon recovered in 2012 to 6.5 bcm and stayed relatively stable the years after until last year 2016 when it dropped to 4.4 bcm.
In 1971, after the United States and Algeria, Libya became the third country in the world to export liquefied natural gas. Processed in Masra El-Brega LNG plant, LNG was mostly exported to Spain but the plant was damaged in 2011 and since then Libya has not exported LNG again.
Azerbaijan
Reserves
Azerbaijan’s proven reserves amount to roughly 1,100 bcm (12,100 TWh). The vast majority of these reserves come from the Shah Deniz field which turned Azerbaijan into a net exporter of natural gas in 2007. Besides that, gas is also produced from the Absheron and Umid fields. As it is shown in the next figure, domestic consumption has been stable for the past decade. Around half of the country’s natural gas consumption is currently for power generation and it could further increase if Azerbaijan continues to install new gas fired power plants.
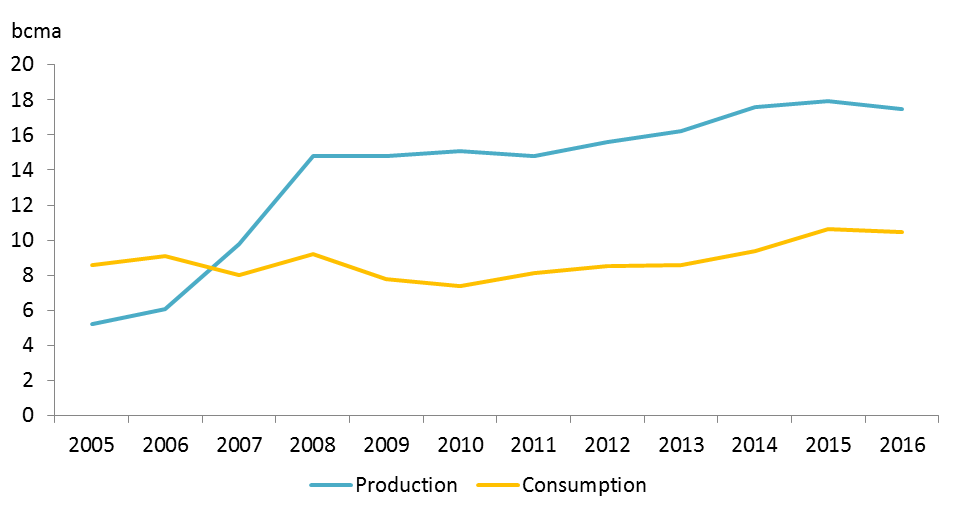
Figure 30 - Azerbaijan's dry natural gas production and consumption 2005-2016. Source BP Statistical Review 2017
Most of Azeri gas is exported to Turkey via the South Caucasus Pipeline from Baku to Erzurum as the main export pipeline. Some volumes are also exported to Russia via the Gazi-Magomed-Mozdok Pipeline and to Iran via the Baku-Astara Pipeline.
Shah Deniz Field
The potential exports of Azeri gas to Europe are closely linked to the development of this field. Discovered in 1999, it holds approximately 1,000 bcm (11,000 TWh) of natural gas reserves and its development is undertaken by a BP-led consortium. Gas production began in early 2007 and it has increased since then, reaching a production of almost 10 bcm (110 TWh/y) last year 2015. Phase 2 will add another 16 bcma (176 TWh/y) of gas production with the first deliveries estimated in 2019, of which 6 bcma (66 TWh/y) are already contracted by Turkey.
The additional 10 bcma (110 TWh/y) are contracted by Southern Europe countries expecting supply via Turkey through the Trans Anatolian Pipeline (TANAP) and Trans Adriatic Pipeline (TAP) projects, in combination with the extension of the South Caucasus Pipeline, which are planned to provide gas to Europe by mid-2019.
- LNG
LNG enables the connection of Europe to the global market and a large number of producing countries in the Middle East, the Atlantic (including the Mediterranean) and the Pacific basins. It gives access to reliable and diversified supply offering the shippers arbitrage opportunities at a global scale between different sources and regional markets.
- Liquefaction vs. regasification capacity
As shown in the next figure, in 2016 the regasification capacity remains more than twice higher than the liquefaction capacity.
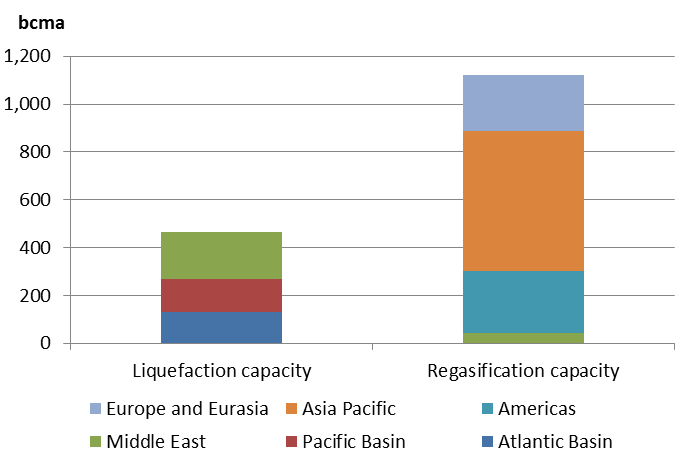
Figure 31 - Liquefaction vs. Regasification capacity. Source GIIGNL 2017
- Regasification capacity
The regasification capacity was expanded in 2016 by 44 bcma with eleven new terminals commissioned around the world and five expansion projects were also completed, four in Asia and one in Argentina. Additionally, there are nineteen terminals currently under construction and also seven expansion projects with a total regasification capacity of 118 bcma, 70% of which (82 bcma) are located in Asia.
- Liquefaction capacity
The existing liquefaction capacity increased by around 49 bcma in 2016 and another 148 bcma of new liquefaction capacity is currently under construction, mainly based in the United States (79 bcma) and Australia (37 bcma), demonstrating that the gap shown in the previous figure might keep on shrinking during the following years. Moreover, two new FIDs were also taken during 2016, one located in the United States, and another one in Indonesia.
- LNG production
Global production reached its historical maximum level of 342 bcm (3,762 TWh) in 2016 recovering after decreasing in 2012. Since 2001, production has more than doubled. The growth has been more significant in Middle East where LNG production has been multiplied by four. In the same period the LNG production in the other regions grew as well but to a lesser extent.
The different evolutions followed by the three 47% market share in 2016, while Middle East and Atlantic basins shares has been reduced to 36% and 17% respectively .
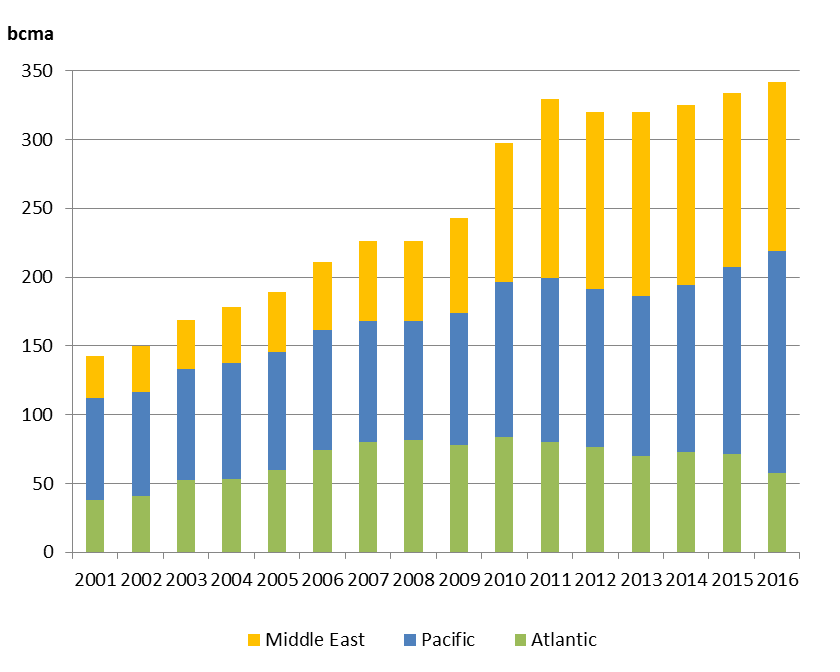
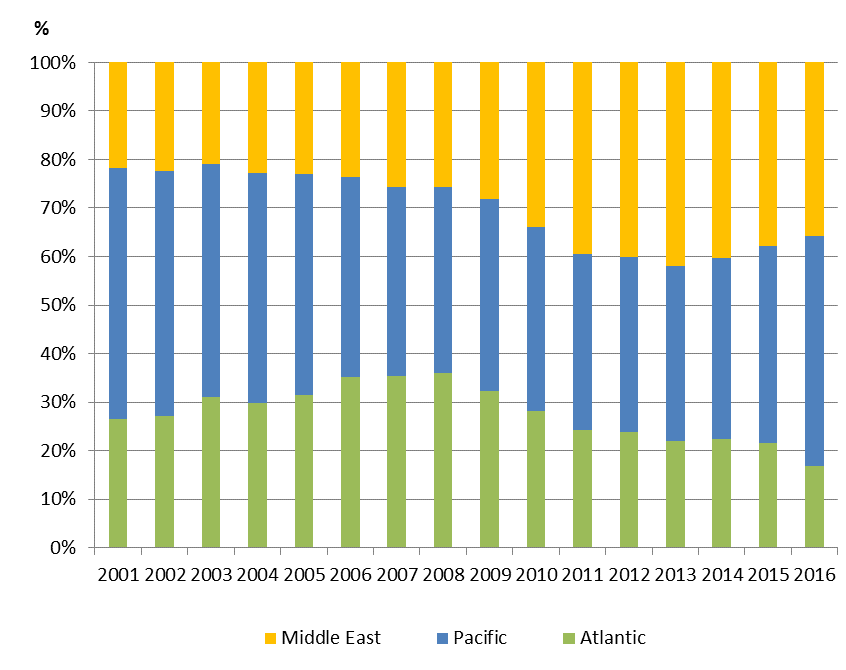
Figure 32: Evolution of LNG production by basin 2001-2016 (source BP statistical reports 2002-2016)
- Atlantic basin
The LNG production in the Atlantic basin reached its maximum in 2010 with 83.5 bcm (918 TWh), since then it decreased by 30% to 57.3 bcm. In 2016, the biggest Atlantic basin LNG producer was Nigeria (23.7 bcm), followed by Algeria (15.9 bcm) and Trinidad and Tobago (14.3 bcm).
- Middle East
The LNG production in the Middle East showed a steady increase until
The production increased sharply in 2010 and 2011 thanks to the commissioning of new liquefaction trains in Qatar. Since the peak of 134 bcm in 2013, the evolution of this basin has steadily decreased to 122 bcm (1,342 TWh) in 2016. The production in the Middle East has been mainly dominated by Qatar over the years reaching a market share 85% (104 bcm) in 2016. Other producers in the region are Oman and Arab Emirates, both with market shares below 10%.
Pacific Basin
The LNG production in the Pacific basin reached a maximum in 2016 with 162 bcm (1,782 TWh). Australia has experienced a substantial increase in LNG production over the last few years reaching a market share of 35% (57 bcm) of the Pacific Basin in 2016, followed by Malaysia with 20 % (32 bcm) as the main LNG producing countries in the Pacific basin.
- LNG imports
The next figures show the clear dominance of Asia Pacific in the evolution of the breakdown by geographical area of LNG imports for the period 2001-2016. In this period the share of Asia Pacific in the LNG market has oscillated between 62 % and 75 %. Far from these shares, the second main LNG market has been Europe (including Eurasia). Their maximum share of the global LNG imports was reached in 2009 with 29 % before dropping down to 17 % in 2015. Since 2010 the American markets have compensated each other with a simultaneous decrease of North American imports and an increase of South American imports.
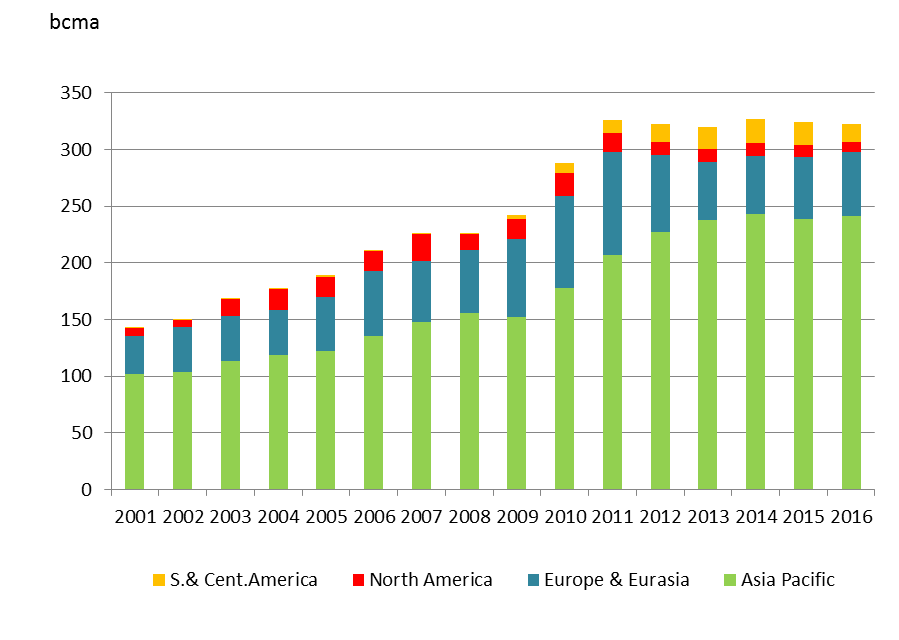
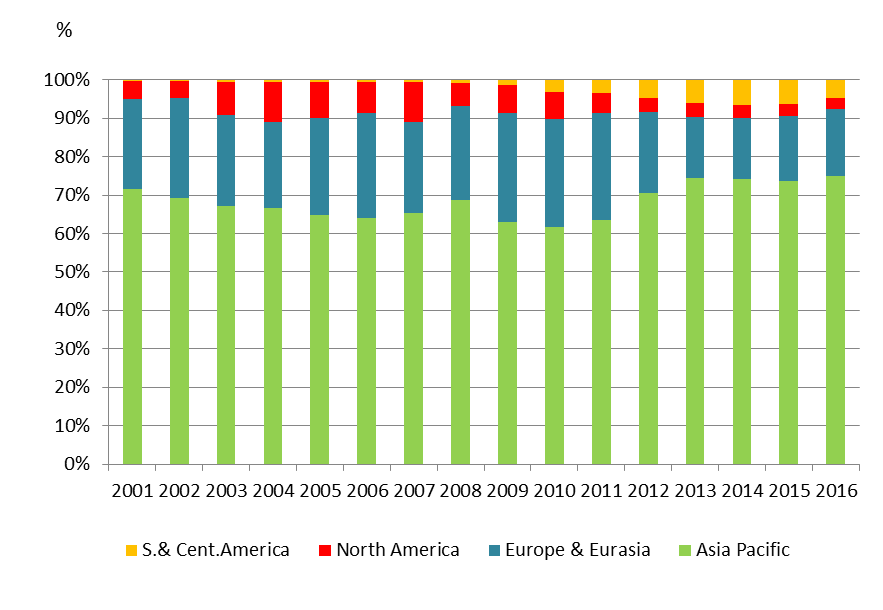
Figure 33: Evolution of LNG imports. Breakdown by geographical area. 2001-2016 (BP statistical reports 2002-2017)
- Asia Pacific
The Asia Pacific gas market is strongly dominated by Japan and South Korea. Japanese LNG imports grew from 2011 following the nuclear accident in Fukushima, reaching 121 bcma in 2014. In 2016 Japan showed a market share of 45% (108 bcm) followed by South Korea with 18% (44 bcm). The remaining countries in the region, like China, India and Taiwan, showed a sharp increase in consumption in the last few years, which is expected to continue in the future.
- North America
From 2001, the North American market was limited to the US, where a strong growth was expected to be met by increasing imports. After the shale gas revolution, decrease of US LNG imports since 2007, 22 bcm dropped to 2.5 bcm last year. Mexican LNG imports started in 2006 and accounted for 68% (6 bcm) of the LNG demand of the region in 2016.
- South and Central America
Until 2008 only small volumes were imported to Puerto Rico and Dominican Republic. Since 2008 Chile, Brazil and Argentina have become LNG importers. In 2016 Argentina (5.2 bcm) and Chile (4.3 bcm) account together for two thirds of the market and Brazil has a market share of 19% (3 bcm).
- EU and Turkey
After a period of high growth, the LNG consumption fell sharply by 48% in 2016 when compared to the peak of 84 bcm in 2011. While European LNG import fell down last year to 43 bcma, Turkish LNG imports grew to almost 8 bcma.
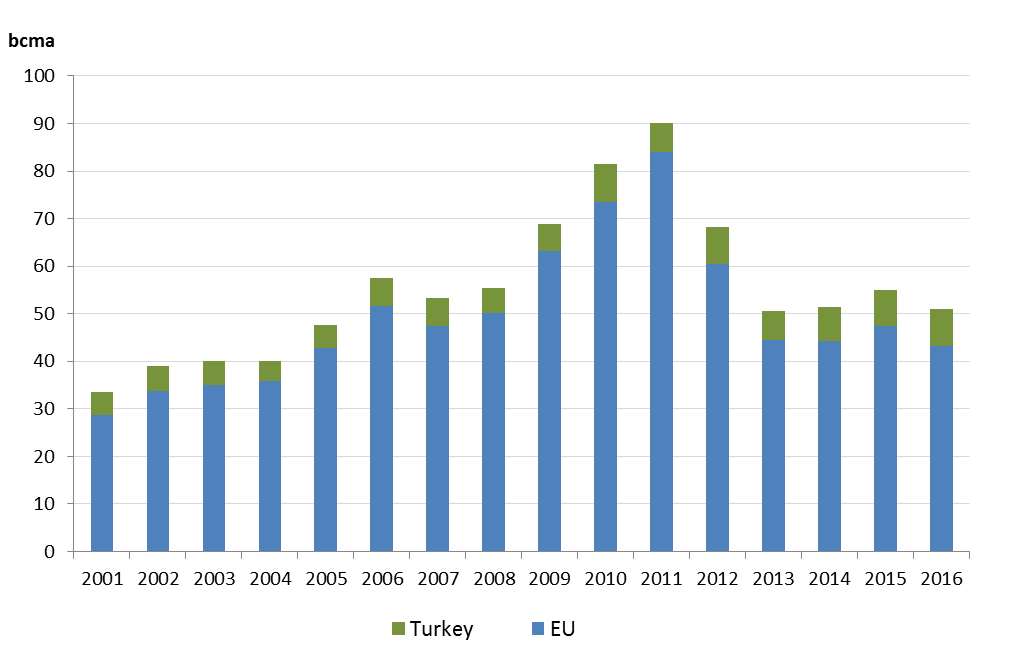
Figure 34: Evolution of LNG imports in Europe-Eurasia. 2001-2016 (Source BP statistical reports 2002-2017)
In 2016, the EU imported LNG from more than 10 different origins around the world. The number of different origins supplying LNG to the EU has remained between 7 and 12 during the last decade. With new increasing number of LNG liquefaction plants located all around the world and the decreasing EU domestic production, higher LNG volumes will be available to arrive in Europe in the upcoming years, contributing further to increasing diversification, supply competition and security of supply.
- Other potential Sources
Other potential sources of gas supply for the future have been investigated but not included in the report due to their high uncertainty and that there are currently no facilities to export this gas to Europe and no Final Investment Decision has been taken yet in any foreseen project. These potential sources are Iran, Turkmenistan and Egypt. On the other hand, ENTSOG’s investigations found out that Israel has the potential to export abroad of its neighbouring countries in the near future.
Israel
Israel currently has 200 bcm of proved gas reserves but the two offshore fields Leviathan and Tamar in the Eastern Mediterranean Sea could reach total estimated reserves of almost 1 Tcm.
Israel’s priority is to protect its energy security and in 2013 approved an export cap of 40% of the country's natural gas reserves as an estimation to supply the national domestic demand for 25 years. Israel is anyway open to export additional gas to countries like Egypt or Jordan, to which Leviathan partners have already agreed to supply 45 bcm over the next 15 years.
Leviathan Phase I consists of two stages and once completed there will be an estimated surplus of Leviathan gas of around 9 bcma, still available to be contracted for exports, starting from 2019. Some options for Israeli gas are considering LNG exports, supply gas directly to Turkey or Greece, the latter through the Trans-Med project.
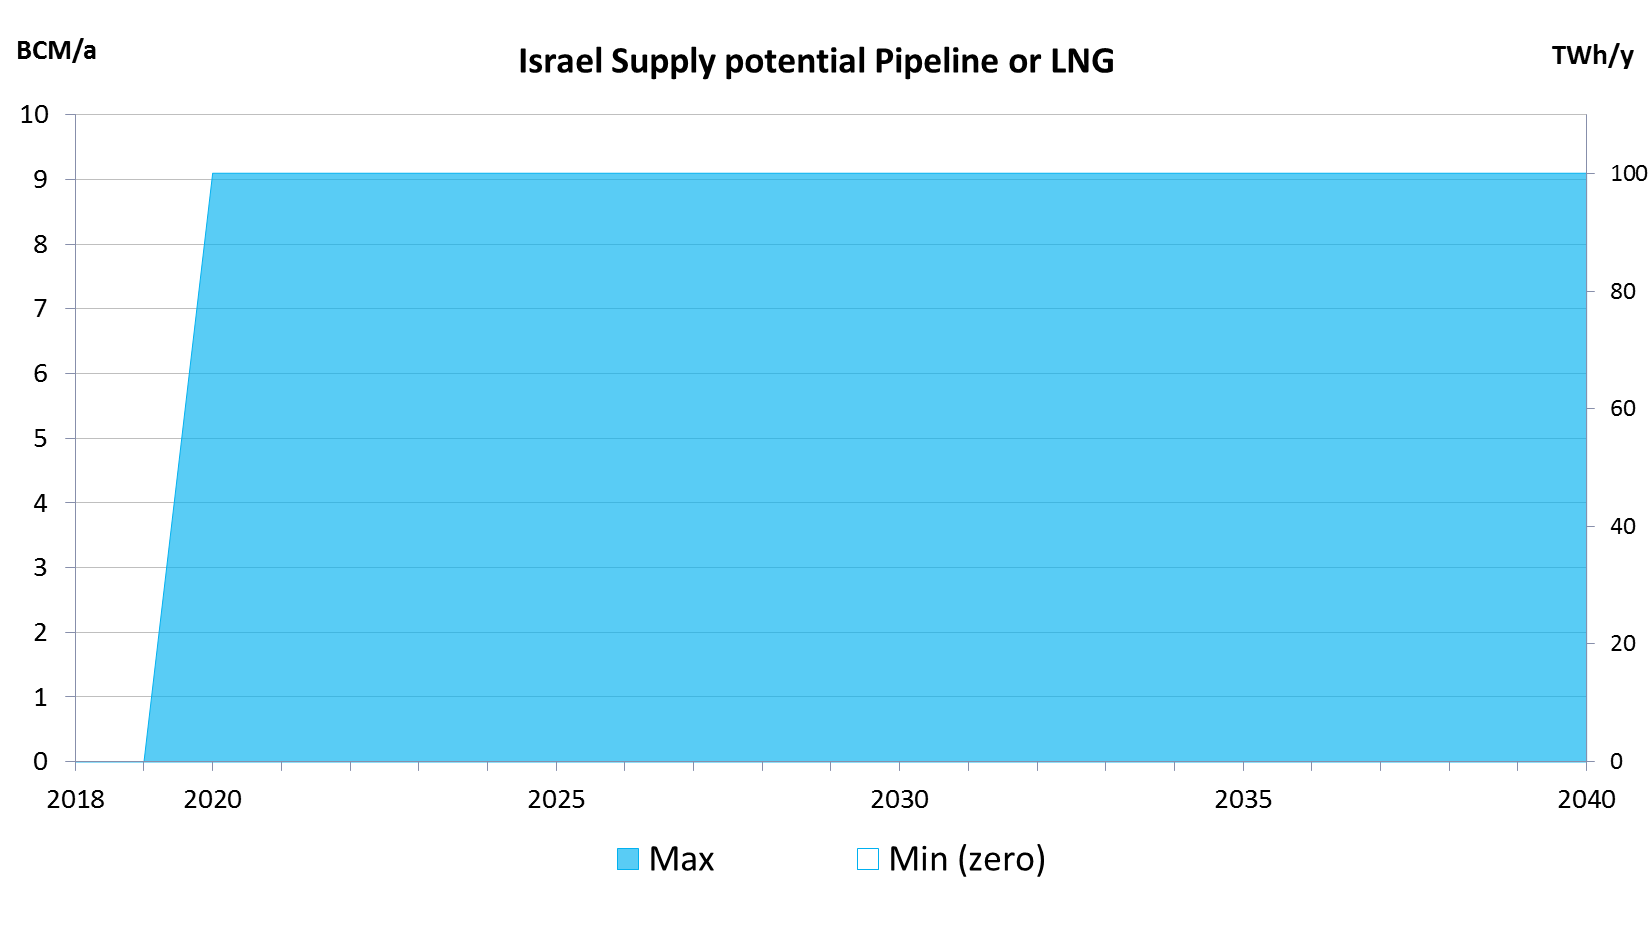
Figure 35 – Israel supply potential