Benchmarking
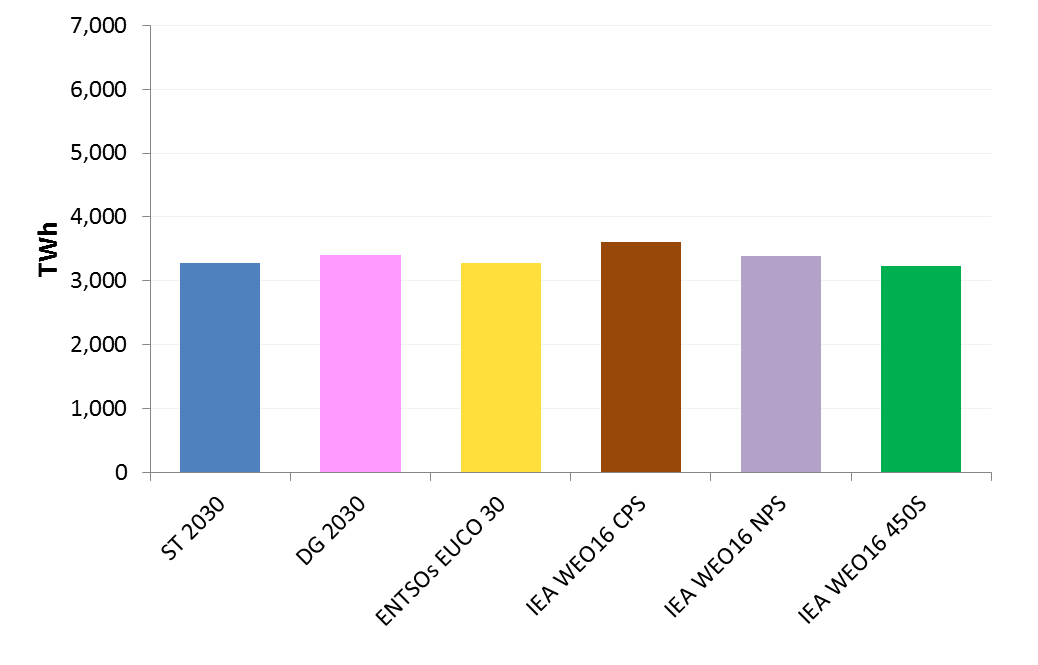
Although all scenario development processes follow different assumptions and use different modelling techniques, the ENTSOs see value in benchmarking the output against other sources of information. The charts below offer a comparison in terms of demand for both sectors against those in the IEA World Energy Outlook 20166. Similar values can be seen for both sectors, showing that despite different scenario assumptions, there are certain consistencies in terms of demand evolution seen by IEA and the scenario development from the ENTSOs.
Electricity Demand
2030 Scenario comparison with IEA World Energy Outlook 2016
2040 Scenario comparison with IEA World Energy Outlook 2016
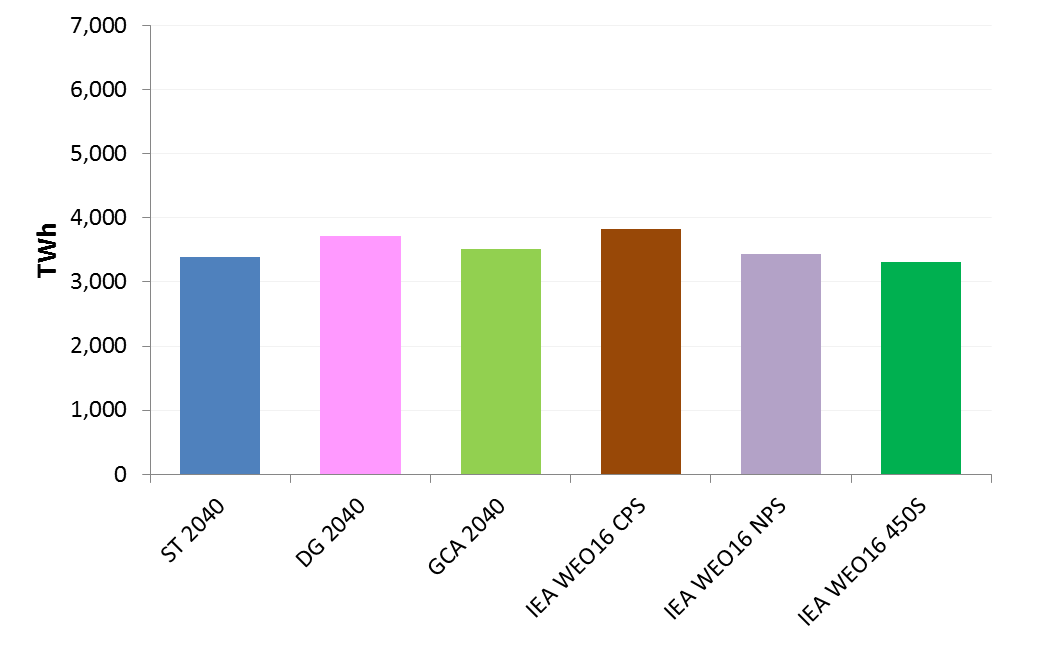
Figure 16: Electricity demand comparison to WEO 2016 scenarios
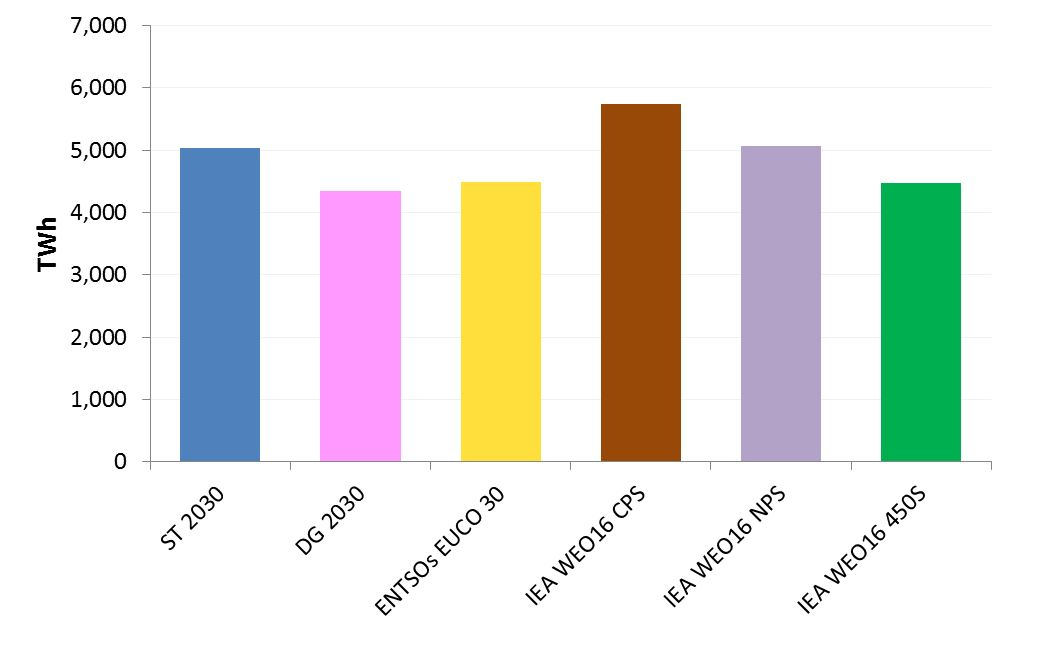
Gas Demand
2030 Scenario comparison with IEA World Energy Outlook 2016 (EU)
2040 Scenario comparison with IEA World Energy Outlook 2016 (EU)
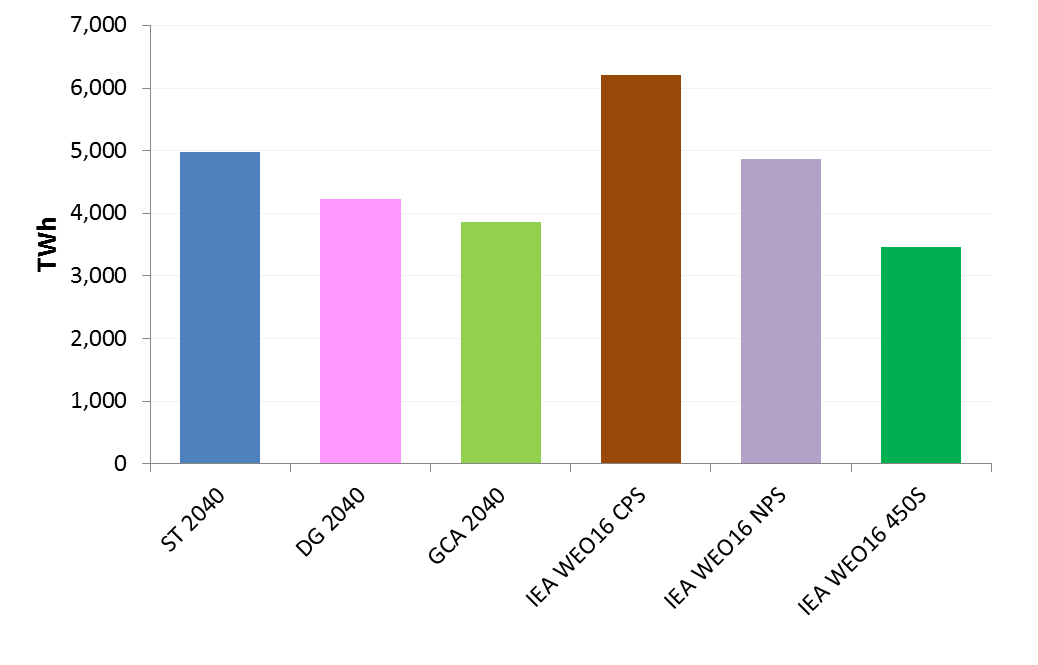
Figure 17: Gas demand comparison to WEO 2016 scenarios